Simultaneous determination of notoginsenoside R1 and ginsenosides Rg1, Re, Rb1 in dietary supplements by HPLC-DAD
A method using solid phase extraction (SPE) and high performance liquid chromatography
with diode array detector (HPLC-DAD) has been optimized for the simultaneous determination
of notoginsenoside R1 and three ginsenosides Rg1, Re, Rb1 in solid, oil, and liquid dietary
supplements. The substances were separated by an InertSustain C18 column (250 mm × 4.6 mm
i.d.; particle size 5 µm) with a gradient program composed of acetonitrile and water. Linearities
were in the range of 4.0 - 400 µg/mL with the coefficients of determination were more than
0.999. The limits of detection and limits of quantitation were 2.13 - 6.89 µg/g and 7.11 - 22.98
µg/g, respectively. The recovery values of the compounds were in the range of 87.2 - 103.5%.
The precision study showed the intra-day relative standard deviation (RSD) of 1.41 - 2.91%, and
inter-day RSD of 1.87 - 4.85%, which meet the AOAC International requirements. The method
was applied to determine the content of notoginsenoside R1, ginsenoside Rg1, ginsenoside Re,
and ginsenoside Rb1 in 20 dietary supplement samples containing Ginseng and Pseudoginseng.
Trang 1
Trang 2
Trang 3
Trang 4
Trang 5
Trang 6
Trang 7

Trang 8
Trang 9
Trang 10
Tải về để xem bản đầy đủ
Tóm tắt nội dung tài liệu: Simultaneous determination of notoginsenoside R1 and ginsenosides Rg1, Re, Rb1 in dietary supplements by HPLC-DAD
Research Article
160 Vietnamese Journal of Food Control, Vol. 4, No. 2, 2021
Simultaneous determination of notoginsenoside R1 and
ginsenosides Rg1, Re, Rb1 in dietary supplements by HPLC-DAD
Dam Thi Thu1*, Nguyen Thi Kieu Anh2, Nguyen Thi Thanh Phuong1
Nguyen Thi Hong Hanh1, Nguyen Thanh Đat1
1Hanoi Drugs, Cosmetics, Food Quality Control Center, Hanoi, Vietnam
2Hanoi University of Pharmacy, Hanoi, Vietnam
(Received: 02/03/2021; Accepted: 27/04/2021)
Abstract
A method using solid phase extraction (SPE) and high performance liquid chromatography
with diode array detector (HPLC-DAD) has been optimized for the simultaneous determination
of notoginsenoside R1 and three ginsenosides Rg1, Re, Rb1 in solid, oil, and liquid dietary
supplements. The substances were separated by an InertSustain C18 column (250 mm × 4.6 mm
i.d.; particle size 5 µm) with a gradient program composed of acetonitrile and water. Linearities
were in the range of 4.0 - 400 µg/mL with the coefficients of determination were more than
0.999. The limits of detection and limits of quantitation were 2.13 - 6.89 µg/g and 7.11 - 22.98
µg/g, respectively. The recovery values of the compounds were in the range of 87.2 - 103.5%.
The precision study showed the intra-day relative standard deviation (RSD) of 1.41 - 2.91%, and
inter-day RSD of 1.87 - 4.85%, which meet the AOAC International requirements. The method
was applied to determine the content of notoginsenoside R1, ginsenoside Rg1, ginsenoside Re,
and ginsenoside Rb1 in 20 dietary supplement samples containing Ginseng and Pseudoginseng.
Keyword: notoginsenosid, ginsenoside Rg1, ginsenoside Re, ginsenoside Rb1, supplements,
HPLC.
1. INTRODUCTION
Recently, the demand use of traditional medicine and health supplement derived from
natural herbal has been growing. Rare medicinal herbs such as Ginseng (Panax ginseng) and
Pseudoginseng (Panax pseudoginseng) that have many preventive and therapeutic effects have
become potential sources of raw materials for these products. Currently, these products are being
sold in many pharmacies, drug stores, supermarkets, even online sales, and many of them come
from unknown origins. The quality of many health supplement products are not well controlled,
making it difficult for consumers to choose effective products. On the other hand, Ginseng and
Pseudoginseng are medicinal herbs that have many species and are often counterfeited in the
market [1].
There have been many studies proving that ginsenoside Rg1 (Rg1), ginsenoside Rb1 (Rb1),
ginsenoside Re (Re), and notoginsenoside R1 (R1) are typical active ingredients, represented for
biological effects of Panax ginseng species such as Ginseng, Pseudoginseng, Vietnamese Ginseng,
American Ginseng,... [1-6]. The content of these active ingredients is the basis for determining
the quality of ginseng species according to current Pharmacopoeia standards. The published
*Corresponding author: Tel: 0962603383 Email: thubanghien@gmail.com
161Vietnamese Journal of Food Control, Vol. 4, No. 2, 2021
Dam Thi Thu, Nguyen Thi Kieu Anh, Nguyen Thi Thanh Phuong,... Nguyen Thanh Đat
health supplement products also use the content of the above active ingredients as quality
control criteria [3-6]. However, the Vietnamese Pharmacopoeia has only a separate monograph
for the medicinal herbs of Ginseng, Pseudoginseng, and Vietnamese Ginseng, which regulates
the determination of the ginsenosides and notoginsenoside R1 content by high-performance
liquid chromatography (HPLC). In the US Pharmacopoeia, 43 dietary supplements have quality
regulations for Ginseng medicinal powder and Ginseng extract powder, but these regulations
are applied for one-ingredient products only. Methods for determination of these compounds
in mixed health supplement products which contain Ginseng, Pseudoginseng, and many other
medicinal herbs or vitamins, minerals in the form of tablets, powder, liquid... have not been
published. Therefore, it is necessary to develop a method that meets the current regulations
to determine the content of ginsenosides Rg1, Rb1, Re, and notoginsenoside R1 in health
supplement samples. The HPLC method with DAD detector has high specificity, accuracy,
simplicity, ease of implementation, and popularity, which can be applied in many laboratories
that have been selected to carry out this study to analyze and quality control health supplements
containing Ginseng and Pseudoginseng in Vietnam market.
2. MATERIALS AND METHODS
2.1. Equipment
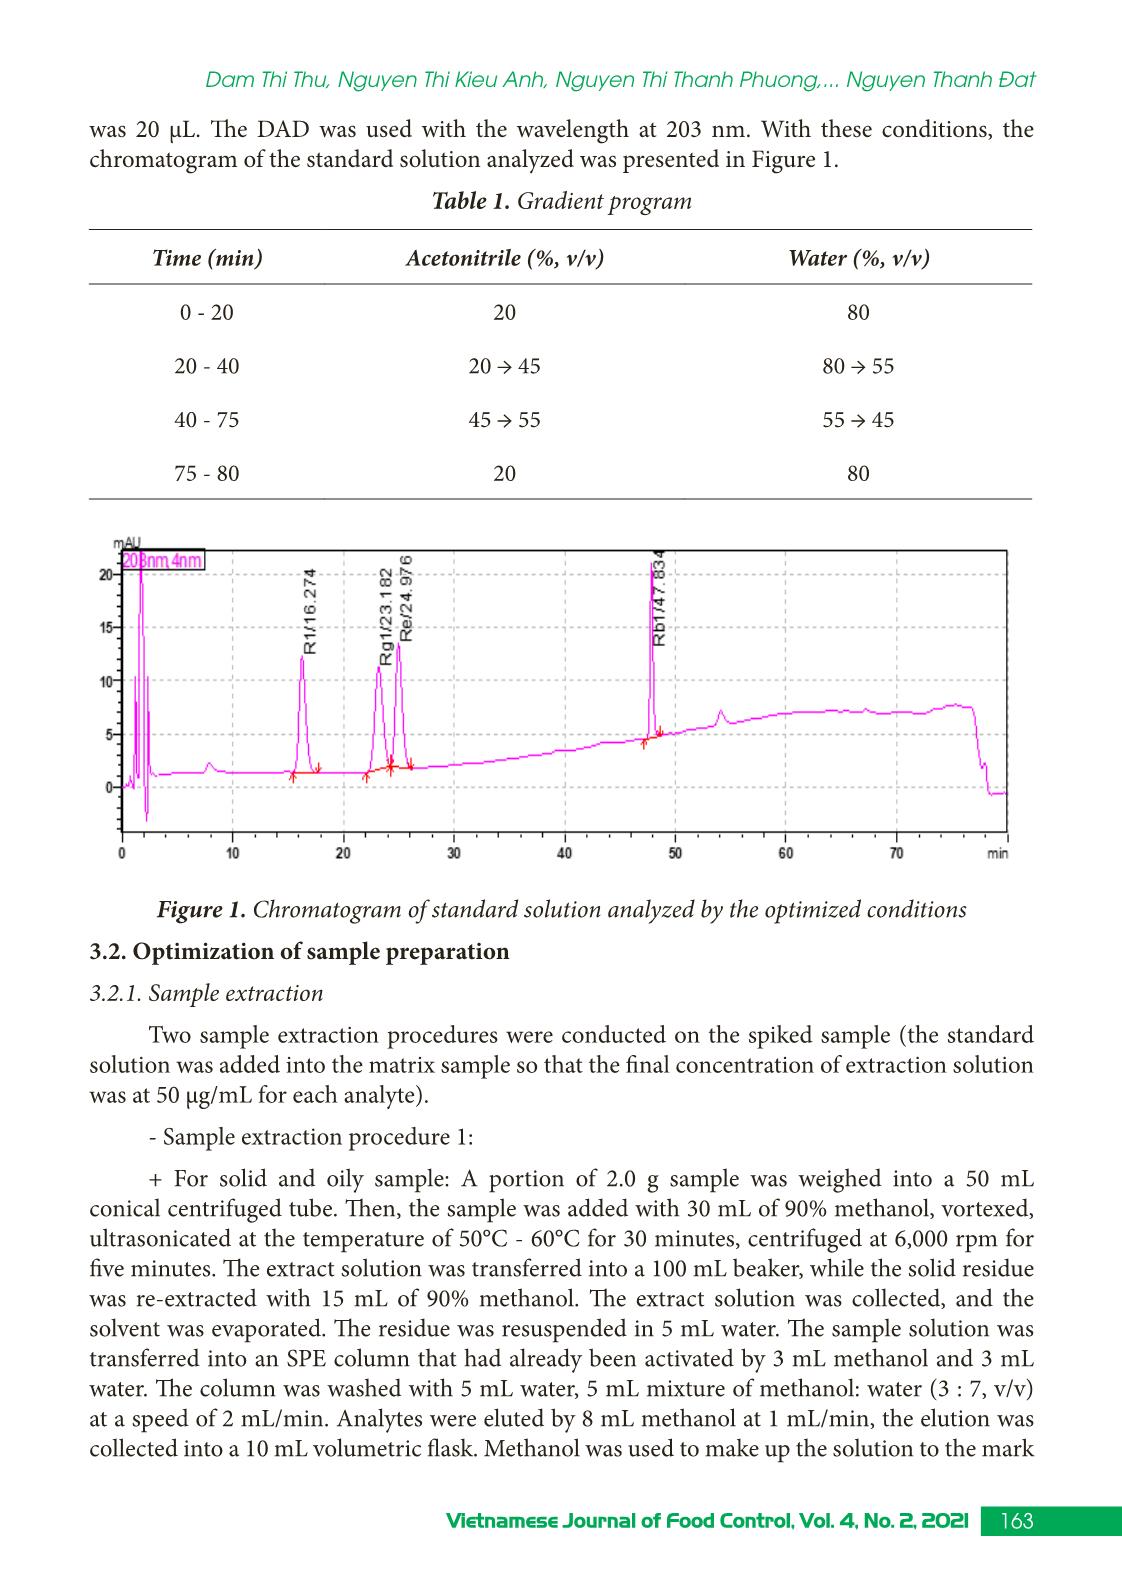
The equipment used in this study has been calibrated according to ISO/IEC 17025 and
GLP which include a liquid chromatography system of Shimadzu - LC-2030C 3D Plus with DAD
(Shimadzu, Japan), a solid-phase extraction (SPE) system (Supelco, US), an analytical balance,
with the accuracy of 0.01 mg (Metler Toledo), and other common laboratory equipment. The
chromatography column was InertSustain C18 (250 × 4.6 m ... tion procedure 2:
+ For solid and oily sample: sample was extracted similarly to procedure 1 except that the
extraction solvent was 70% methanol and the sample was not cleaned through an SPE column.
+ For liquid sample: A portion of 5.0 mL sample was transferred into a 50 mL flask.
Then, the sample was added methanol, ultrasonicated for 30 minutes, cooled down to room
temperature, added methanol to reach 50 mL in total. The solution was filtered through a 0.45
µm membrane.
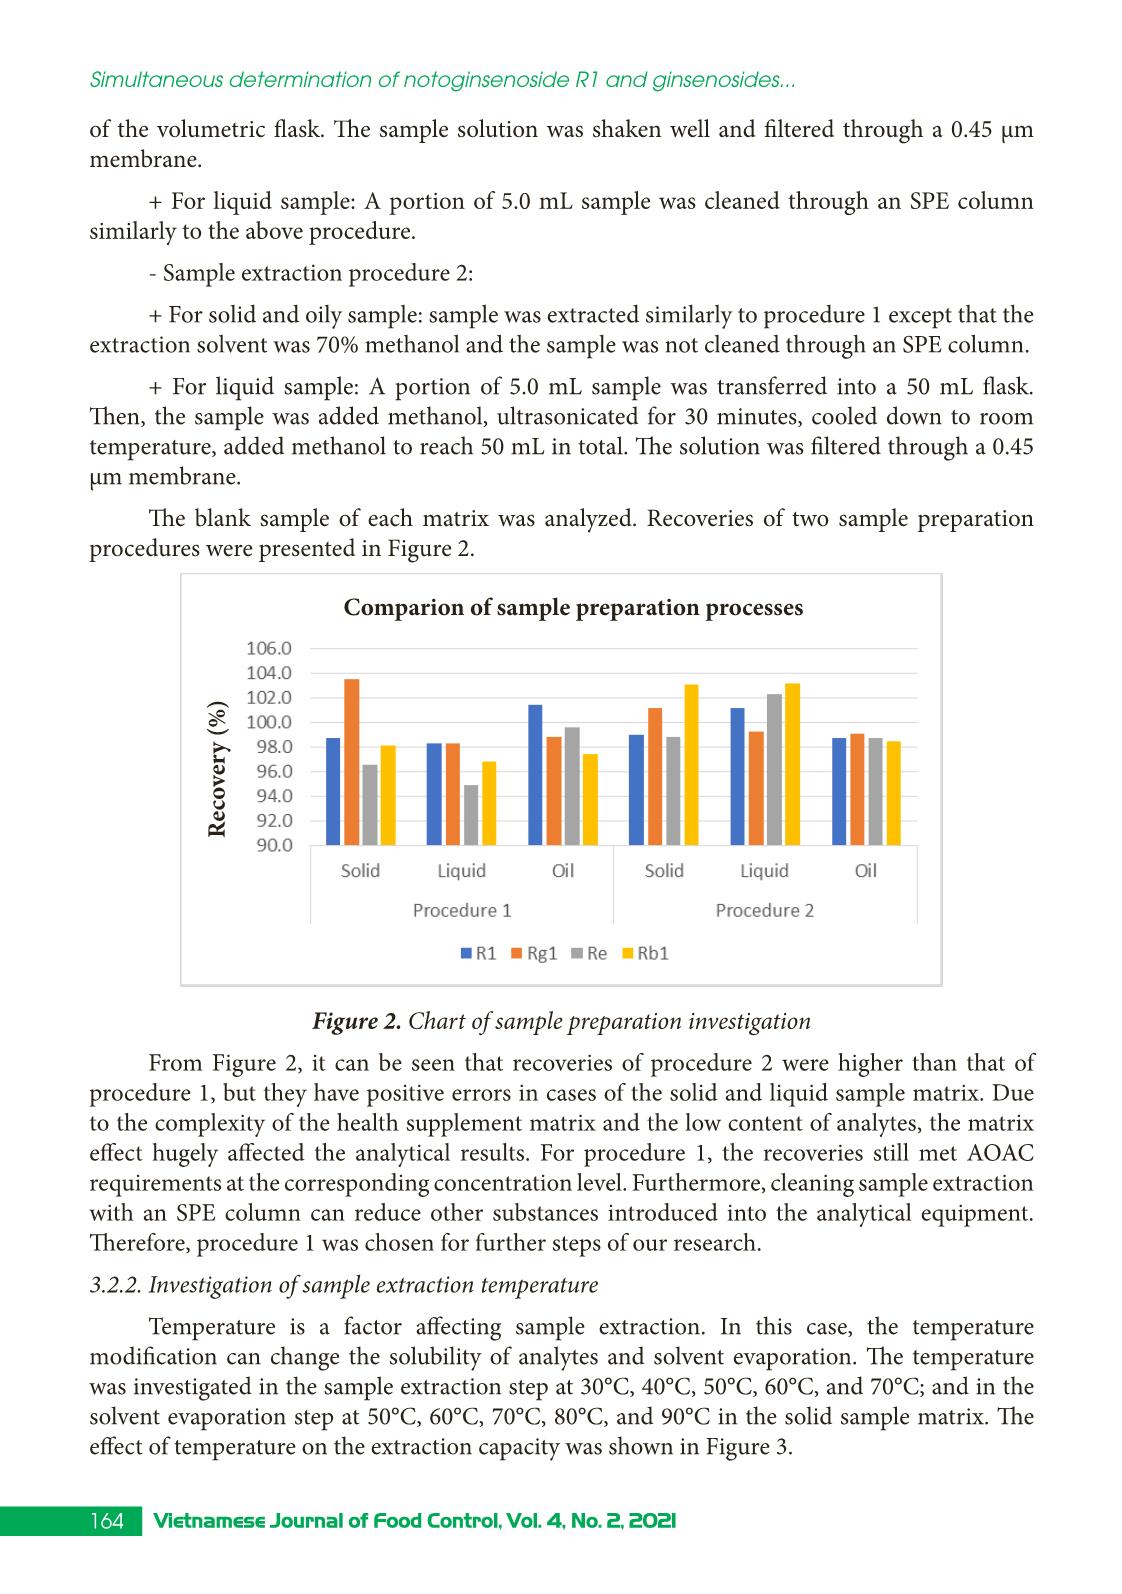
The blank sample of each matrix was analyzed. Recoveries of two sample preparation
procedures were presented in Figure 2.
Figure 2. Chart of sample preparation investigation
From Figure 2, it can be seen that recoveries of procedure 2 were higher than that of
procedure 1, but they have positive errors in cases of the solid and liquid sample matrix. Due
to the complexity of the health supplement matrix and the low content of analytes, the matrix
effect hugely affected the analytical results. For procedure 1, the recoveries still met AOAC
requirements at the corresponding concentration level. Furthermore, cleaning sample extraction
with an SPE column can reduce other substances introduced into the analytical equipment.
Therefore, procedure 1 was chosen for further steps of our research.
3.2.2. Investigation of sample extraction temperature
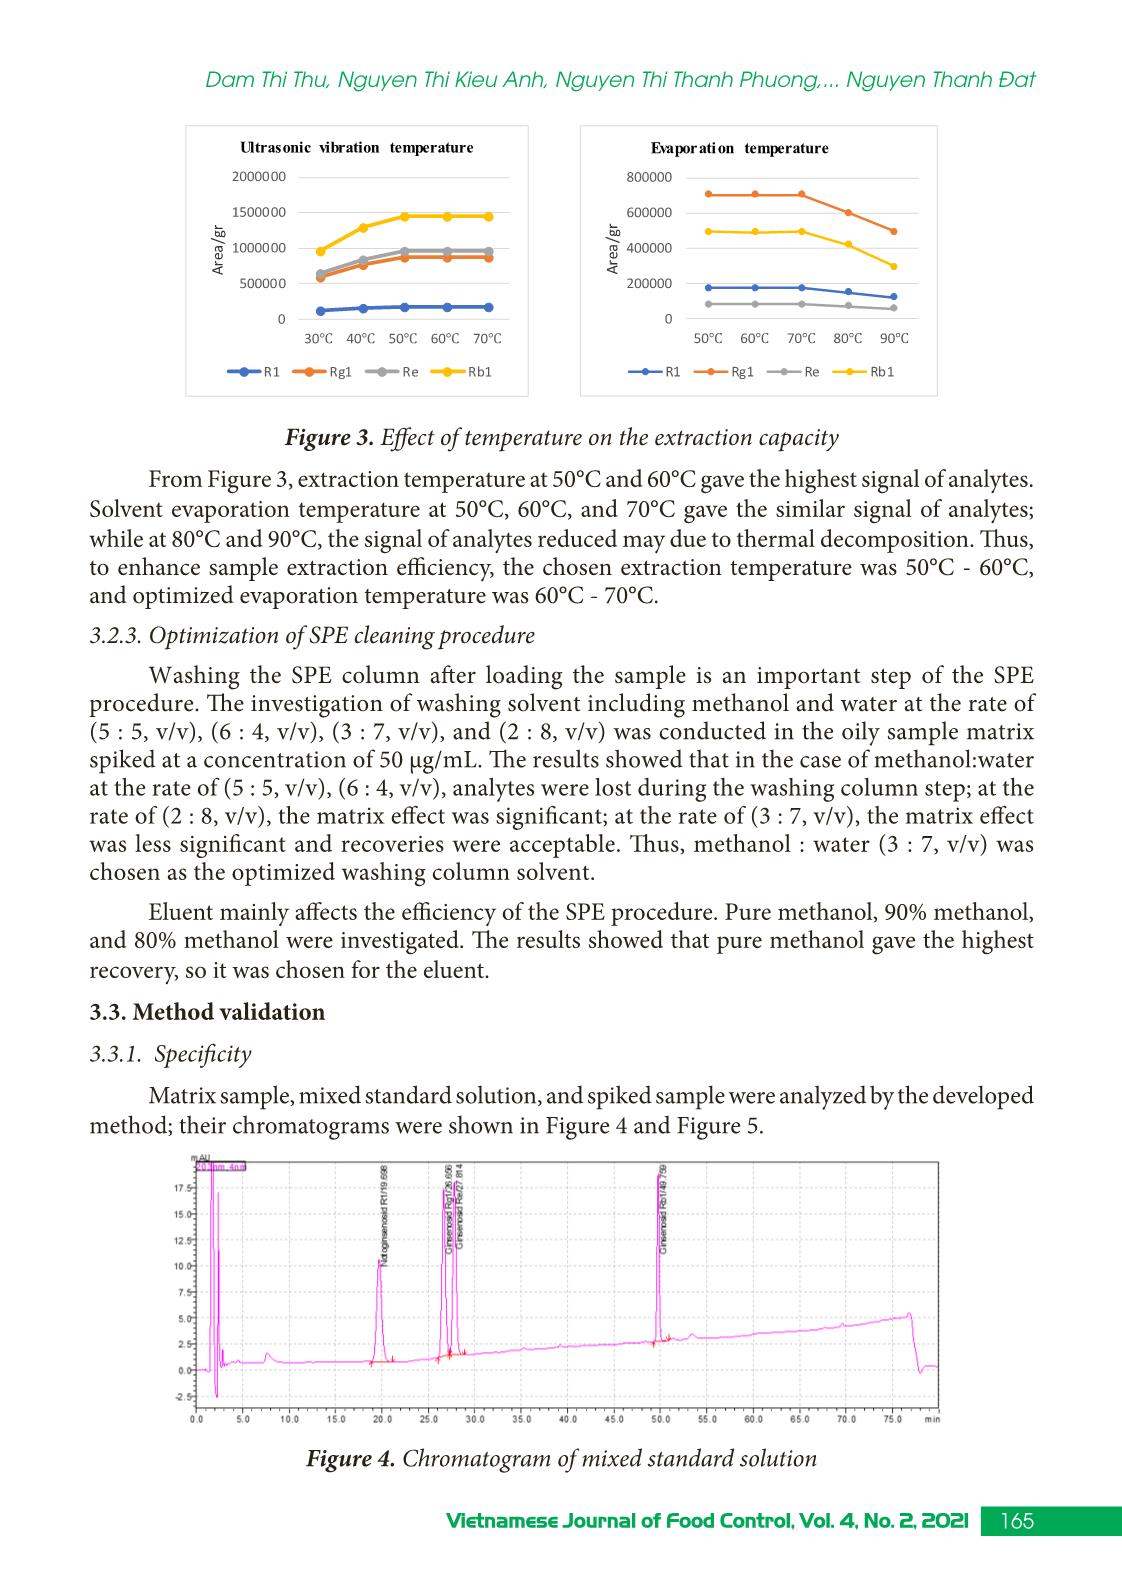
Temperature is a factor affecting sample extraction. In this case, the temperature
modification can change the solubility of analytes and solvent evaporation. The temperature
was investigated in the sample extraction step at 30°C, 40°C, 50°C, 60°C, and 70°C; and in the
solvent evaporation step at 50°C, 60°C, 70°C, 80°C, and 90°C in the solid sample matrix. The
effect of temperature on the extraction capacity was shown in Figure 3.
Comparion of sample preparation processes
Re
co
ve
ry
 (%
)
165Vietnamese Journal of Food Control, Vol. 4, No. 2, 2021
Dam Thi Thu, Nguyen Thi Kieu Anh, Nguyen Thi Thanh Phuong,... Nguyen Thanh Đat
0
500000
1000000
1500000
2000000
30℃ 40℃ 50℃ 60℃ 70℃
Ar
ea
/g
r
Ultrasonic vibration temperature
R1 Rg1 Re Rb1
0
200000
400000
600000
800000
50℃ 60℃ 70℃ 80℃ 90℃
Ar
ea
/g
r
Evaporation temperature
R1 Rg1 Re Rb1
Figure 3. Effect of temperature on the extraction capacity
From Figure 3, extraction temperature at 50°C and 60°C gave the highest signal of analytes.
Solvent evaporation temperature at 50°C, 60°C, and 70°C gave the similar signal of analytes;
while at 80°C and 90°C, the signal of analytes reduced may due to thermal decomposition. Thus,
to enhance sample extraction efficiency, the chosen extraction temperature was 50°C - 60°C,
and optimized evaporation temperature was 60°C - 70°C.
3.2.3. Optimization of SPE cleaning procedure
Washing the SPE column after loading the sample is an important step of the SPE
procedure. The investigation of washing solvent including methanol and water at the rate of
(5 : 5, v/v), (6 : 4, v/v), (3 : 7, v/v), and (2 : 8, v/v) was conducted in the oily sample matrix
spiked at a concentration of 50 µg/mL. The results showed that in the case of methanol:water
at the rate of (5 : 5, v/v), (6 : 4, v/v), analytes were lost during the washing column step; at the
rate of (2 : 8, v/v), the matrix effect was significant; at the rate of (3 : 7, v/v), the matrix effect
was less significant and recoveries were acceptable. Thus, methanol : water (3 : 7, v/v) was
chosen as the optimized washing column solvent.
Eluent mainly affects the efficiency of the SPE procedure. Pure methanol, 90% methanol,
and 80% methanol were investigated. The results showed that pure methanol gave the highest
recovery, so it was chosen for the eluent.
3.3. Method validation
3.3.1. Specificity
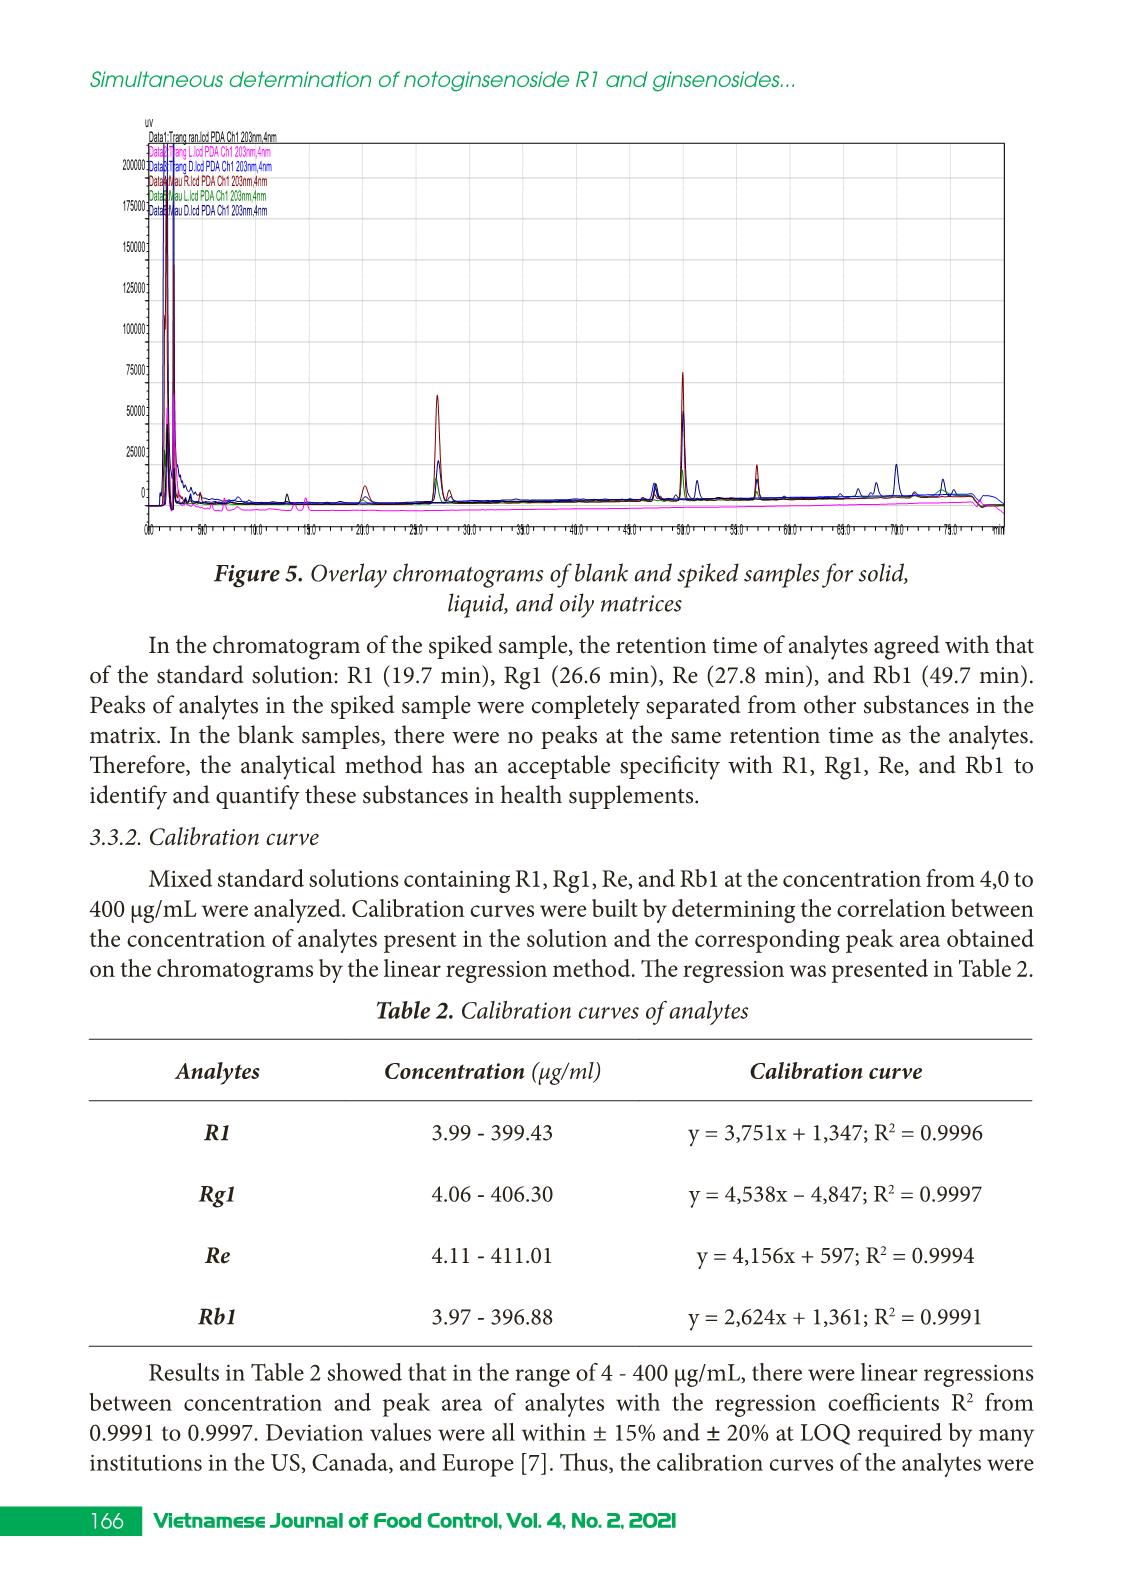
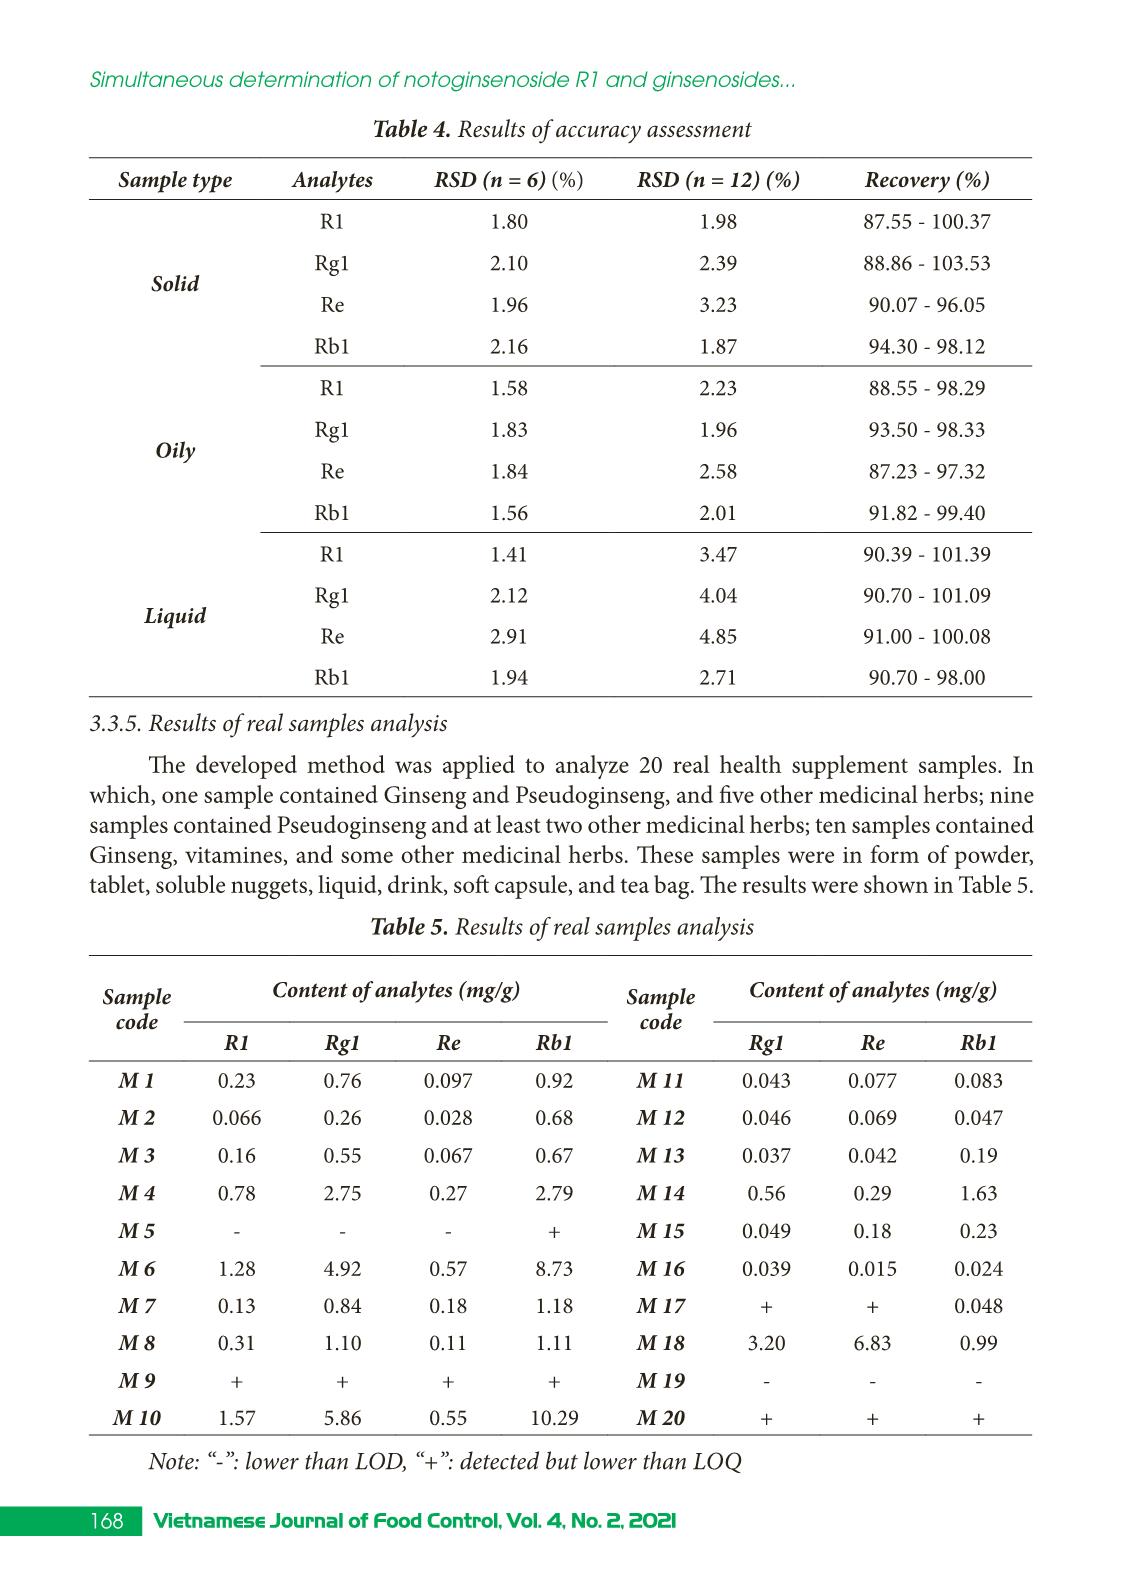
Matrix sample, mixed standard solution, and spiked sample were analyzed by the developed
method; their chromatograms were shown in Figure 4 and Figure 5.
Figure 4. Chromatogram of mixed standard solution
166 Vietnamese Journal of Food Control, Vol. 4, No. 2, 2021
Simultaneous determination of notoginsenoside R1 and ginsenosides...
0.0 5.0 10.0 15.0 20.0 25.0 30.0 35.0 40.0 45.0 50.0 55.0 60.0 65.0 70.0 75.0 min
0
25000
50000
75000
100000
125000
150000
175000
200000
uV
Data6:Mau D.lcd PDA Ch1 203nm,4nm
Data5:Mau L.lcd PDA Ch1 203nm,4nm
Data4:Mau R.lcd PDA Ch1 203nm,4nm
Data3:Trang D.lcd PDA Ch1 203nm,4nm
Data2:Trang L.lcd PDA Ch1 203nm,4nm
Data1:Trang ran.lcd PDA Ch1 203nm,4nm
Figure 5. Overlay chromatograms of blank and spiked samples for solid,
 liquid, and oily matrices
In the chromatogram of the spiked sample, the retention time of analytes agreed with that
of the standard solution: R1 (19.7 min), Rg1 (26.6 min), Re (27.8 min), and Rb1 (49.7 min).
Peaks of analytes in the spiked sample were completely separated from other substances in the
matrix. In the blank samples, there were no peaks at the same retention time as the analytes.
Therefore, the analytical method has an acceptable specificity with R1, Rg1, Re, and Rb1 to
identify and quantify these substances in health supplements.
3.3.2. Calibration curve
Mixed standard solutions containing R1, Rg1, Re, and Rb1 at the concentration from 4,0 to
400 µg/mL were analyzed. Calibration curves were built by determining the correlation between
the concentration of analytes present in the solution and the corresponding peak area obtained
on the chromatograms by the linear regression method. The regression was presented in Table 2.
Table 2. Calibration curves of analytes
Analytes Concentration (µg/ml) Calibration curve
R1 3.99 - 399.43 y = 3,751x + 1,347; R2 = 0.9996
Rg1 4.06 - 406.30 y = 4,538x – 4,847; R2 = 0.9997
Re 4.11 - 411.01 y = 4,156x + 597; R2 = 0.9994
Rb1 3.97 - 396.88 y = 2,624x + 1,361; R2 = 0.9991
Results in Table 2 showed that in the range of 4 - 400 µg/mL, there were linear regressions
between concentration and peak area of analytes with the regression coefficients R2 from
0.9991 to 0.9997. Deviation values were all within ± 15% and ± 20% at LOQ required by many
institutions in the US, Canada, and Europe [7]. Thus, the calibration curves of the analytes were
167Vietnamese Journal of Food Control, Vol. 4, No. 2, 2021
Dam Thi Thu, Nguyen Thi Kieu Anh, Nguyen Thi Thanh Phuong,... Nguyen Thanh Đat
satisfactory and accepted under the AOAC International requirements.
3.3.3. Limit of detection (LOD), limit of quantification (LOQ)
LOD and LOQ of the developed method were calculated based on the standard deviation
of spiked samples. The spiked samples were added standard solutions so that the concentration
of each analyte in the final extraction solution was 10 µg/mL. These samples were analyzed in
six replicates. From that analysis, the average and standard deviation (SD) were calculated. LOD
and LOQ were calculated as LOD = 3SD, LOQ = 10SD. R-value was calculated as R = x /LOD;
if the R-value was in the range of 4 to 10, the concentration of the tested sample was suitable and
LOD was believable [8]. LOD and LOQ of the developed method corresponding to each type of
samples were presented in Table 3.
Table 3. LOD, LOQ of the developed method
Ana-
lytes
LOD LOQ
R-value
Solid
(µg/g)
Oily
(µg/g)
Liquid
(µg/mL)
Solid
(µg/g)
Oily
(µg/g)
Liquid
(µg/mL)
R1 6.47 5.01 2.13 21.57 16.69 7.11 7.23 - 9.34
Rg1 6.44 6.89 2.45 21.48 22.98 8.16 7.90 - 9.16
Re 5.34 5.34 2.77 17.79 17.79 9.22 7.05 - 8.18
Rb1 4.93 5.76 2.42 16.44 19.20 8.05 6.77 - 9.82
3.3.4. Accuracy
The accuracy of the developed method was estimated from the precision and trueness. Real
samples of each sample type were analyzed six times for inter-day relative standard deviation
RSD (n = 6), and 12 times for intra-day RSD (n = 12). The accuracy of the method was evaluated
based on the recovery of the spiked sample. The sample matrix was added standard solution so
that after sample treatment, analytes have concentrations of about 4 µg/mL, 50 µg/mL, and 400
µg/mL for each of the three sample forms; each concentration level was analyzed three times.
The results were shown in Table 4.
The method had RSD (n = 6) from 1.41 - 2.91% (requirement < 4%) and RSD (n = 12) from
1.29 - 4.85% (requirement < 6%), so the method met the requirement of precision. According to
AOAC, at a concentration of 4 µg/mL (corresponding to 20 µg/g in solid, oil samples and 8 µg/
mL in liquid form), the recovery must reach 85 - 110%; at 50 g/mL (corresponding to 250 µg/g
in solid and oily samples and 100 µg/mL in liquid sample), recovery should reach 90 - 108%; at
400 g/mL (corresponding to 2,000 µg/g in solid and oily sample and 800 g/mL in liquid form),
the recovery should be 92 - 105%. Through the results of Table 4, the method was obtained the
recovery requirements in the respective concentration range [7].
168 Vietnamese Journal of Food Control, Vol. 4, No. 2, 2021
Simultaneous determination of notoginsenoside R1 and ginsenosides...
Table 4. Results of accuracy assessment
Sample type Analytes RSD (n = 6) (%) RSD (n = 12) (%) Recovery (%)
Solid
R1 1.80 1.98 87.55 - 100.37
Rg1 2.10 2.39 88.86 - 103.53
Re 1.96 3.23 90.07 - 96.05
Rb1 2.16 1.87 94.30 - 98.12
Oily
R1 1.58 2.23 88.55 - 98.29
Rg1 1.83 1.96 93.50 - 98.33
Re 1.84 2.58 87.23 - 97.32
Rb1 1.56 2.01 91.82 - 99.40
Liquid
R1 1.41 3.47 90.39 - 101.39
Rg1 2.12 4.04 90.70 - 101.09
Re 2.91 4.85 91.00 - 100.08
Rb1 1.94 2.71 90.70 - 98.00
3.3.5. Results of real samples analysis
The developed method was applied to analyze 20 real health supplement samples. In
which, one sample contained Ginseng and Pseudoginseng, and five other medicinal herbs; nine
samples contained Pseudoginseng and at least two other medicinal herbs; ten samples contained
Ginseng, vitamines, and some other medicinal herbs. These samples were in form of powder,
tablet, soluble nuggets, liquid, drink, soft capsule, and tea bag. The results were shown in Table 5.
Table 5. Results of real samples analysis
Sample
code
Content of analytes (mg/g) Sample
code
Content of analytes (mg/g)
R1 Rg1 Re Rb1 Rg1 Re Rb1
M 1 0.23 0.76 0.097 0.92 M 11 0.043 0.077 0.083
M 2 0.066 0.26 0.028 0.68 M 12 0.046 0.069 0.047
M 3 0.16 0.55 0.067 0.67 M 13 0.037 0.042 0.19
M 4 0.78 2.75 0.27 2.79 M 14 0.56 0.29 1.63
M 5 - - - + M 15 0.049 0.18 0.23
M 6 1.28 4.92 0.57 8.73 M 16 0.039 0.015 0.024
M 7 0.13 0.84 0.18 1.18 M 17 + + 0.048
M 8 0.31 1.10 0.11 1.11 M 18 3.20 6.83 0.99
M 9 + + + + M 19 - - -
M 10 1.57 5.86 0.55 10.29 M 20 + + +
Note: “-”: lower than LOD, “+”: detected but lower than LOQ
169Vietnamese Journal of Food Control, Vol. 4, No. 2, 2021
Dam Thi Thu, Nguyen Thi Kieu Anh, Nguyen Thi Thanh Phuong,... Nguyen Thanh Đat
The results of analysis of 20 commercial health supplement samples showed that the
concentrations of four research substances in the samples were very different: R1 from 0.066
to 1.57 mg/g of sample, Rg1 from 0.037 to 5.86 mg/g sample, Re from 0.015 to 6.92 mg/g
sample, Rb1 from 0.024 to 10.29 mg/g sample. Even, one sample did not detect R1 (< LOD),
two samples did not detect Rg1 and Re (< LOD); some samples (M17, M20, M9) have very low
active ingredient content (< LOQ). In particular, samples M5, M9, M19 did not meet the quality
requirements according to the product announcement on the label. From that, it is necessary to
strengthen the quality control of products announced with Pseudoginseng and Ginseng.
4. CONCLUSIONS
The research has developed a method to simultaneously quantify R1, Rg1, Rb1, and Re in
health supplements by HPLC-DAD. The method was fully validated and met the requirements
of an analytical method according to current AOAC guidelines. The results of applying this
method in 20 commercial samples showed that the developed method was appropriate and
feasible. The research results can provide laboratories with a reference procedure to save costs
when simultaneously quantifying the active ingredients in the health supplements containing
Ginseng and Pseudoginseng.
REFERENCES
[1]. D. T. Loi, Vietnamese medicinal plants and herbs. Hanoi: Medical Publisher, pp.289-290,
804-808, 2006.
[2]. N. T. Hanh, “Research to develop a method to determine some ginsenosides in functional
foods containing Panax ginseng,” Master of Science Thesis, Hanoi University of Science,
Vietnam National University, 2016.
[3]. Ministry of Health, Vietnamese Pharmacopoeia V, vol 2. Hanoi: Medical Publisher, pp.
1279-1280, 1313-1314, 1321-1322, 2017.
[4]. Department of Health Government of the Hong Kong Special Administrative Region,
Hong Kong Chinese Materia Medica Standards, vol. 1, pp. 68-77, 80-89, 2005.
[5]. Medicines and Healthcare products Regulatory Agency, British Pharmacopoeia 2020,
London: The Stationery Office, pp. 248-251, pp. 361-362, 2019.
[6]. U.S. Pharmacopeia National Formulary, The United States Pharmacopeia USP 43 - NF 38,
United Book Press, pp.4774-4775, 2020.
[7]. AOAC - Appendix K: Guidelines for Dietary Supplements and Botanicals - Part I:
AOAC Guidelines for Single-Laboratory Validation of Chemical Methods for Dietary
Supplements and Botanicals, 2013.
[8]. National Institute for Food Control, Method validation in chemical and microbiological
analysis, Sciences and Technology Publisher, pp. 31, 2010.
170 Vietnamese Journal of Food Control, Vol. 4, No. 2, 2021
Simultaneous determination of notoginsenoside R1 and ginsenosides...
Định lượng đồng thời notoginsenoside R1 và ginsenoside Rg1,
Rb1, Re trong thực phẩm bảo vệ sức khỏe bằng HPLC-DAD
Đàm Thị Thu1, Nguyễn Thị Kiều Anh2, Nguyễn Thị Thanh Phương1
Nguyễn Thị Hồng Hạnh1, Nguyễn Thành Đạt1
1Trung tâm Kiểm nghiệm thuốc, mỹ phẩm, thực phẩm Hà Nội, Việt Nam
2Trường Đại học Dược Hà Nội, Việt Nam
Tóm tắt
Nghiên cứu đã tối ưu hóa phương pháp định lượng đồng thời notoginsenoside R1,
ginsenoside Rg1, ginsenoside Re, ginsenoside Rb1 trong chế phẩm thực phẩm bảo vệ sức khỏe
dạng rắn, lỏng, dầu bằng sắc ký lỏng hiệu năng cao (HPLC-DAD) kết hợp kỹ thuật chiết pha
rắn (SPE). Các chất phân tích được tách bằng cột InertSustain C18 (250 × 4,6 mm; 5 µm) với
chương trình rửa giải gradient dung môi gồm acetonitril và nước. Các chất phân tích tuyến tính
trong khoảng từ 4,0 - 400 µg/mL, với hệ số R2 đều lớn hơn 0,999. Phương pháp cho giới hạn
phát hiện và giới hạn định lượng lần lượt nằm trong khoảng 2,13 - 6,89 µg/g chế phẩm và 7,11
- 22,98 µg/g chế phẩm. Độ thu hồi của bốn chất phân tích nằm trong khoảng từ 87,2 - 103,5%.
Độ chụm với độ lệch chuẩn tương đối lặp lại trong ngày là 1,41 - 2,91% và độ lệch chuẩn tương
đối khác ngày là 1,87 - 4,85% đáp ứng yêu cầu của AOAC. Phương pháp đã được ứng dụng để
xác định hàm lượng các chất phân tích trong 20 mẫu thực phẩm bảo vệ sức khỏe chứa Nhân
sâm, Tam thất.
Từ khóa: notoginsenoside R1, ginsenoside Rg1, ginsenoside Re, ginsenoside Rb1, TPBVSK,
HPLC.
File đính kèm:
 simultaneous_determination_of_notoginsenoside_r1_and_ginseno.pdf

