Evaluating the quality of library service in Dong Thap university
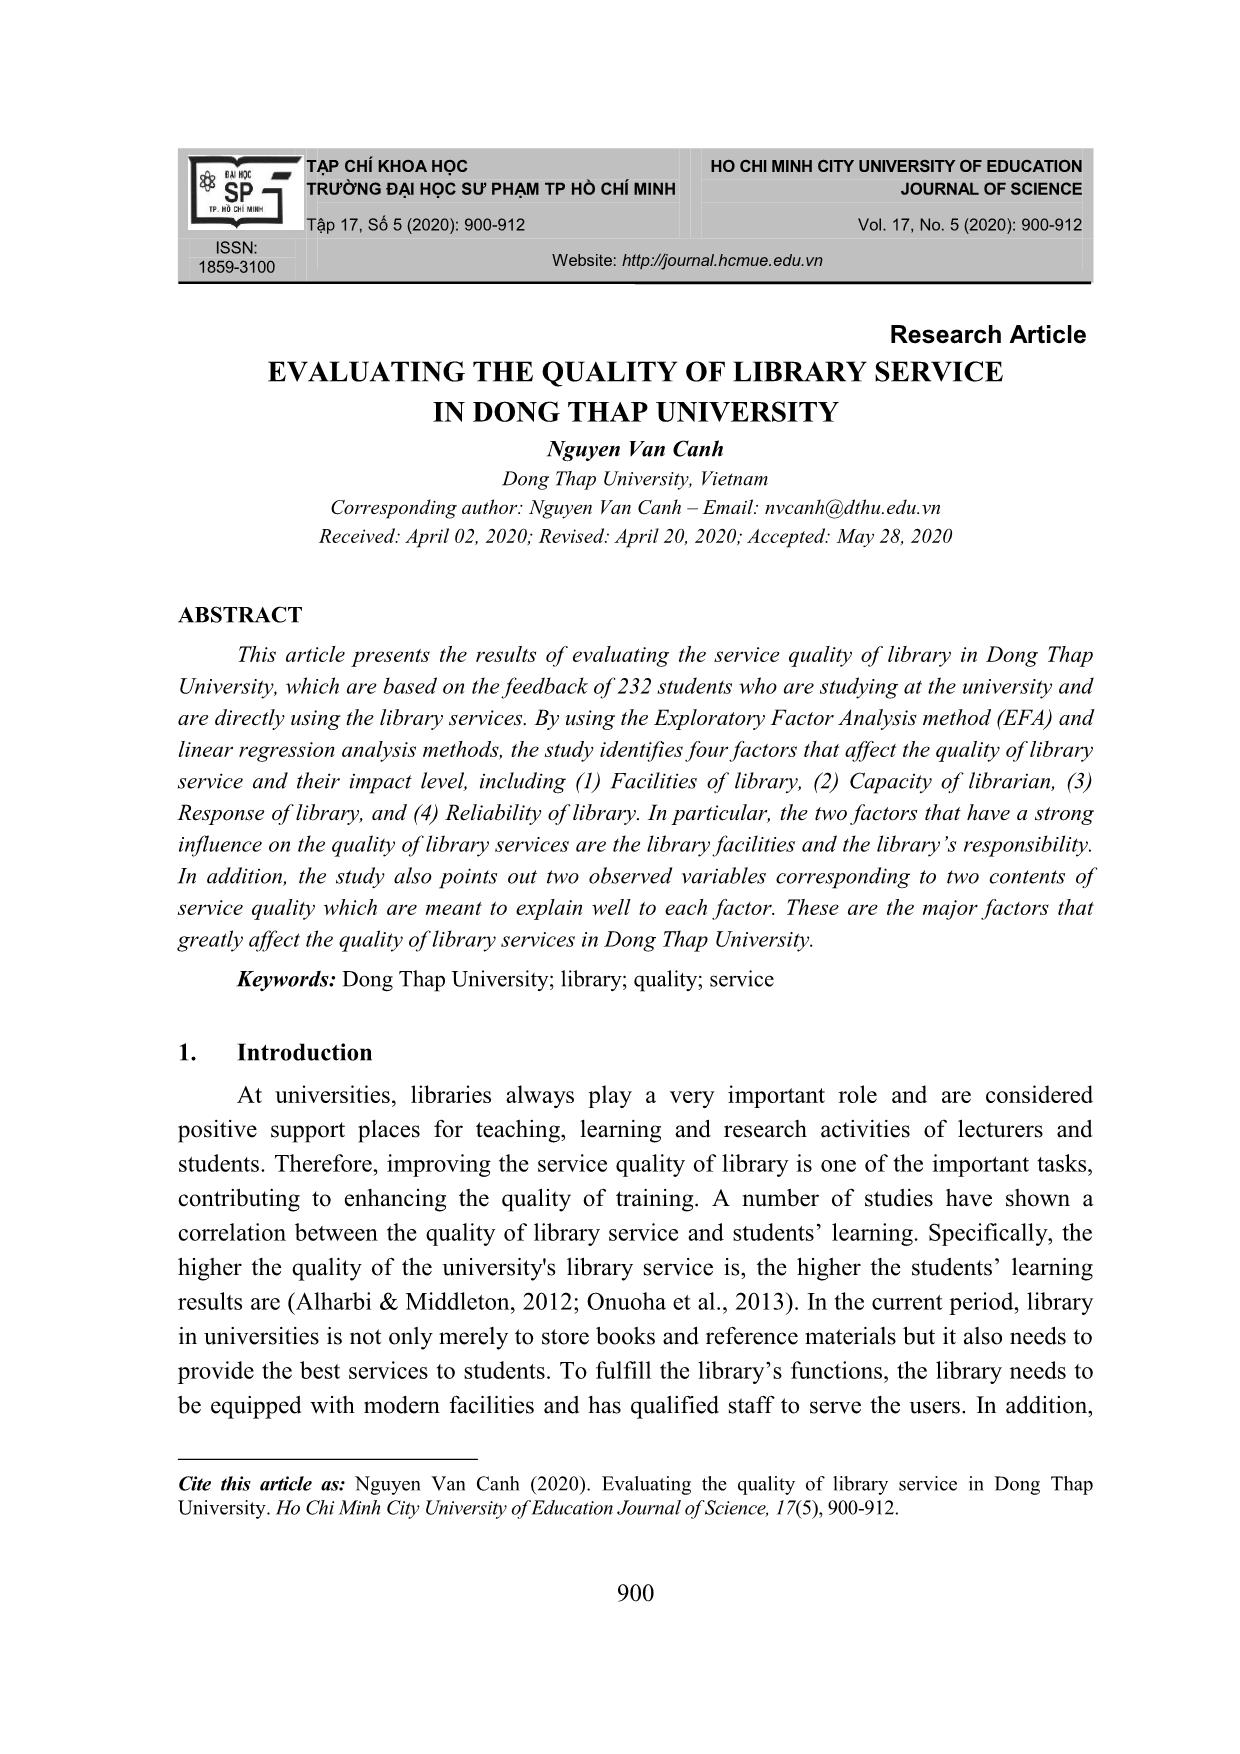
This article presents the results of evaluating the service quality of library in Dong Thap
University, which are based on the feedback of 232 students who are studying at the university and
are directly using the library services. By using the Exploratory Factor Analysis method (EFA) and
linear regression analysis methods, the study identifies four factors that affect the quality of library
service and their impact level, including (1) Facilities of library, (2) Capacity of librarian, (3)
Response of library, and (4) Reliability of library. In particular, the two factors that have a strong
influence on the quality of library services are the library facilities and the library’s responsibility.
In addition, the study also points out two observed variables corresponding to two contents of
service quality which are meant to explain well to each factor. These are the major factors that
greatly affect the quality of library services in Dong Thap University.
Trang 1
Trang 2
Trang 3
Trang 4
Trang 5
Trang 6
Trang 7
Trang 8
Trang 9
Trang 10
Tải về để xem bản đầy đủ
Tóm tắt nội dung tài liệu: Evaluating the quality of library service in Dong Thap university
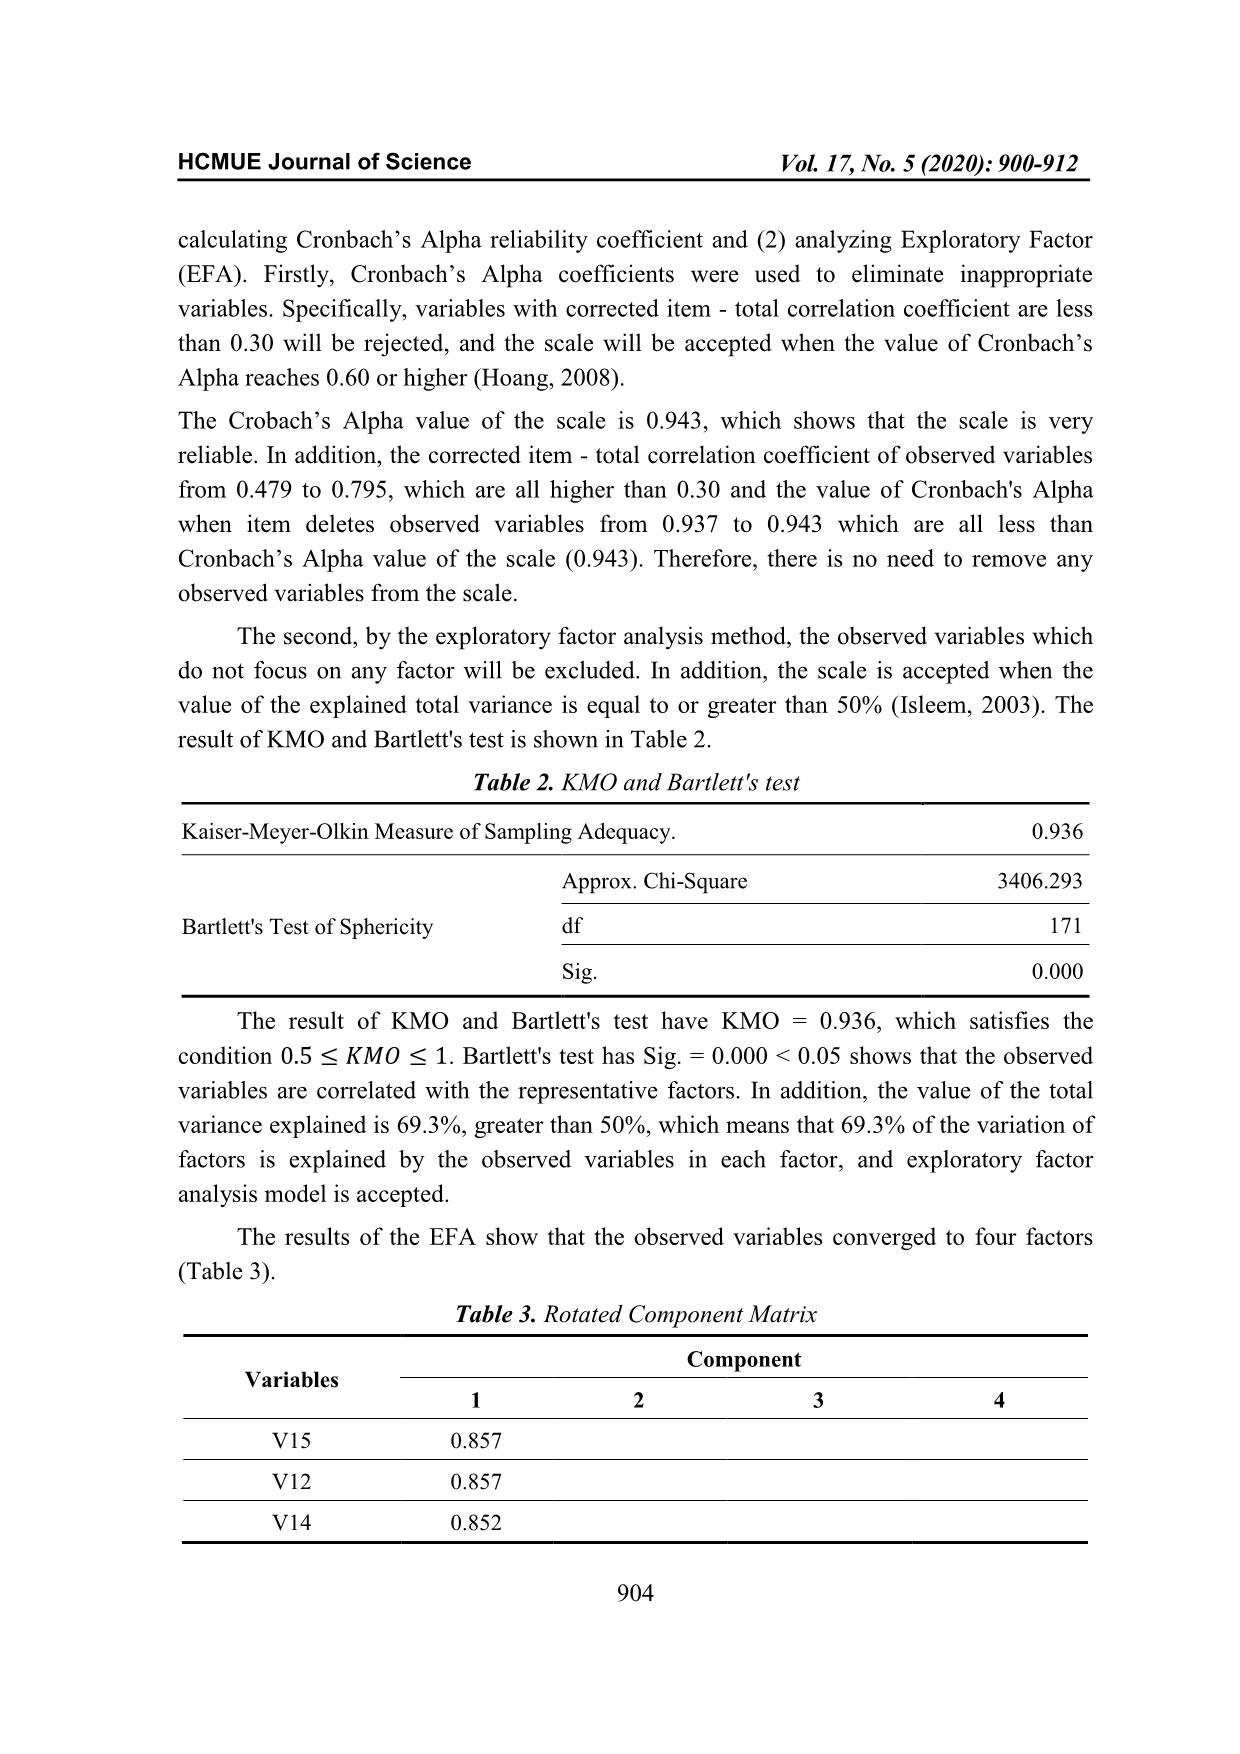
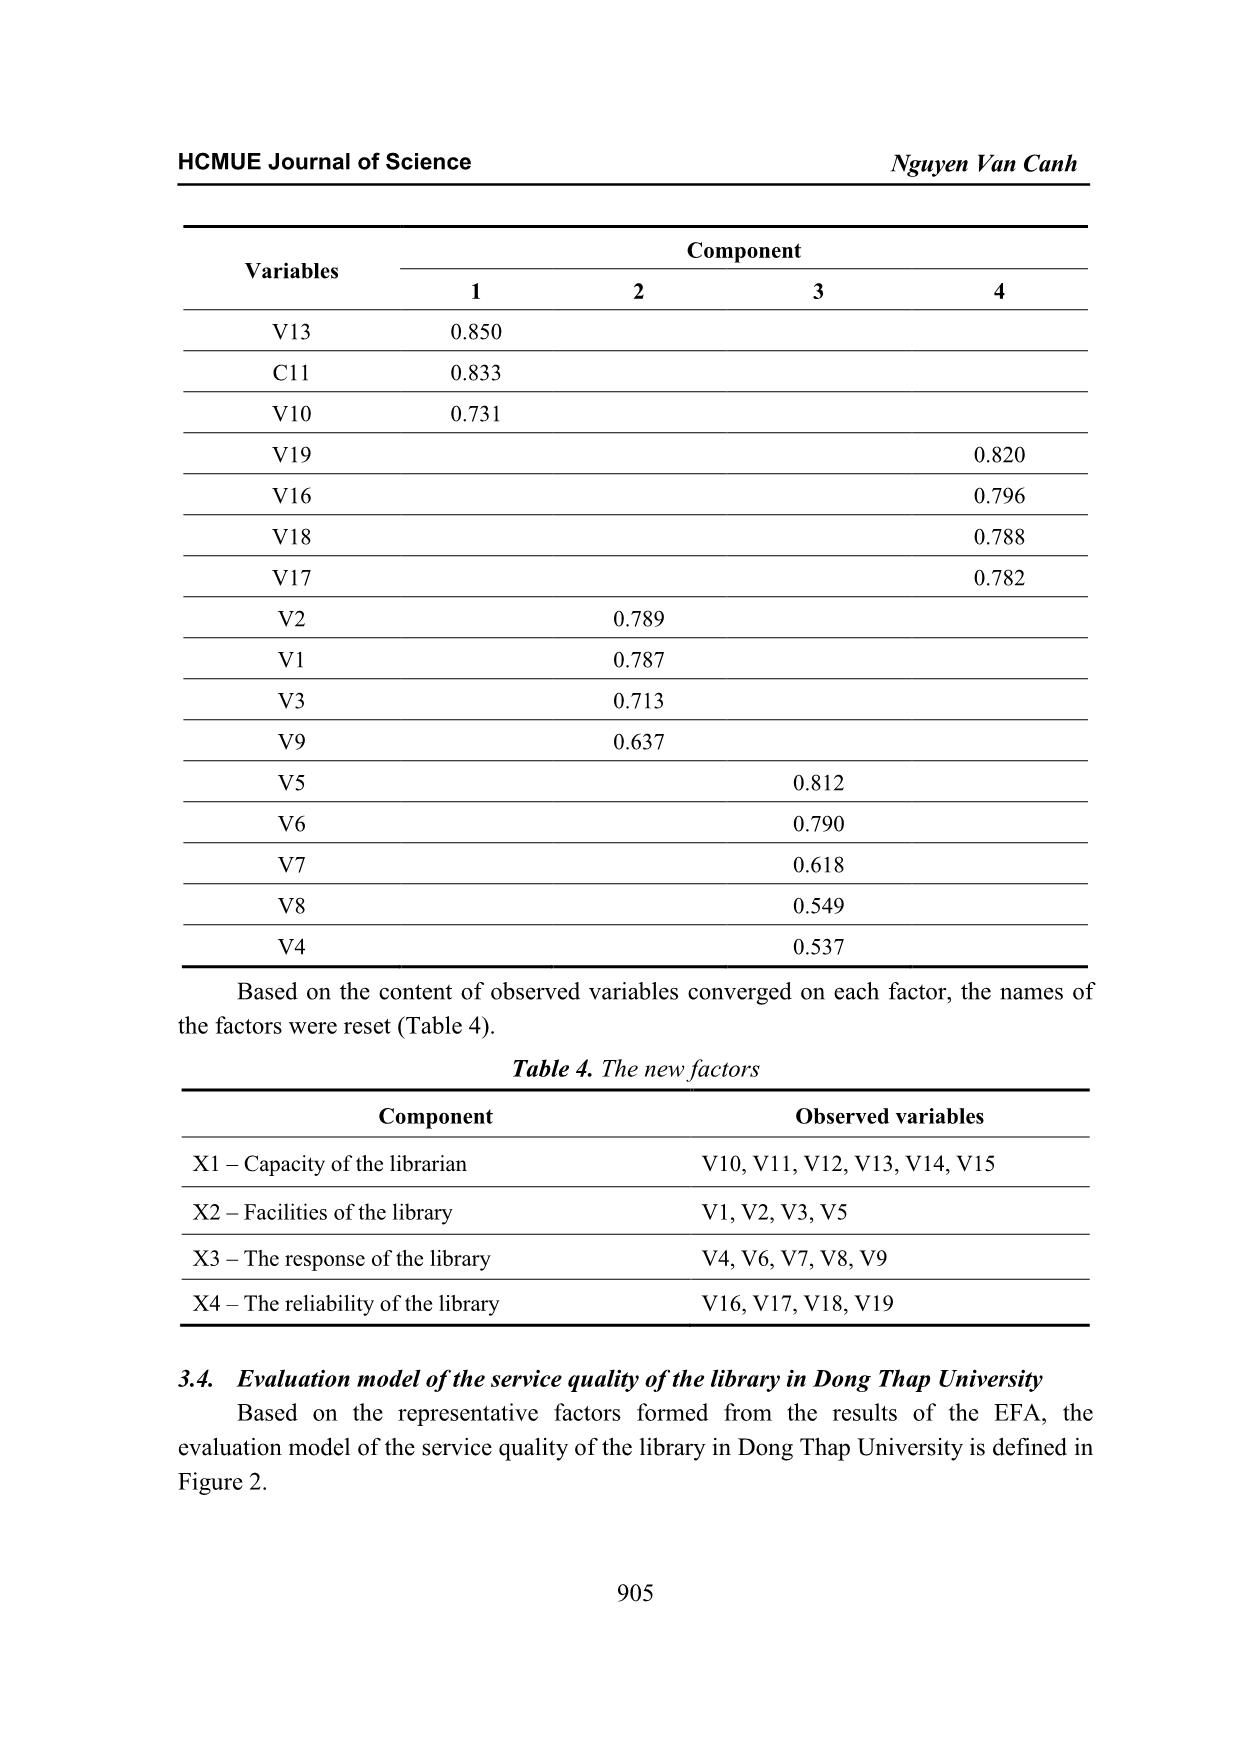
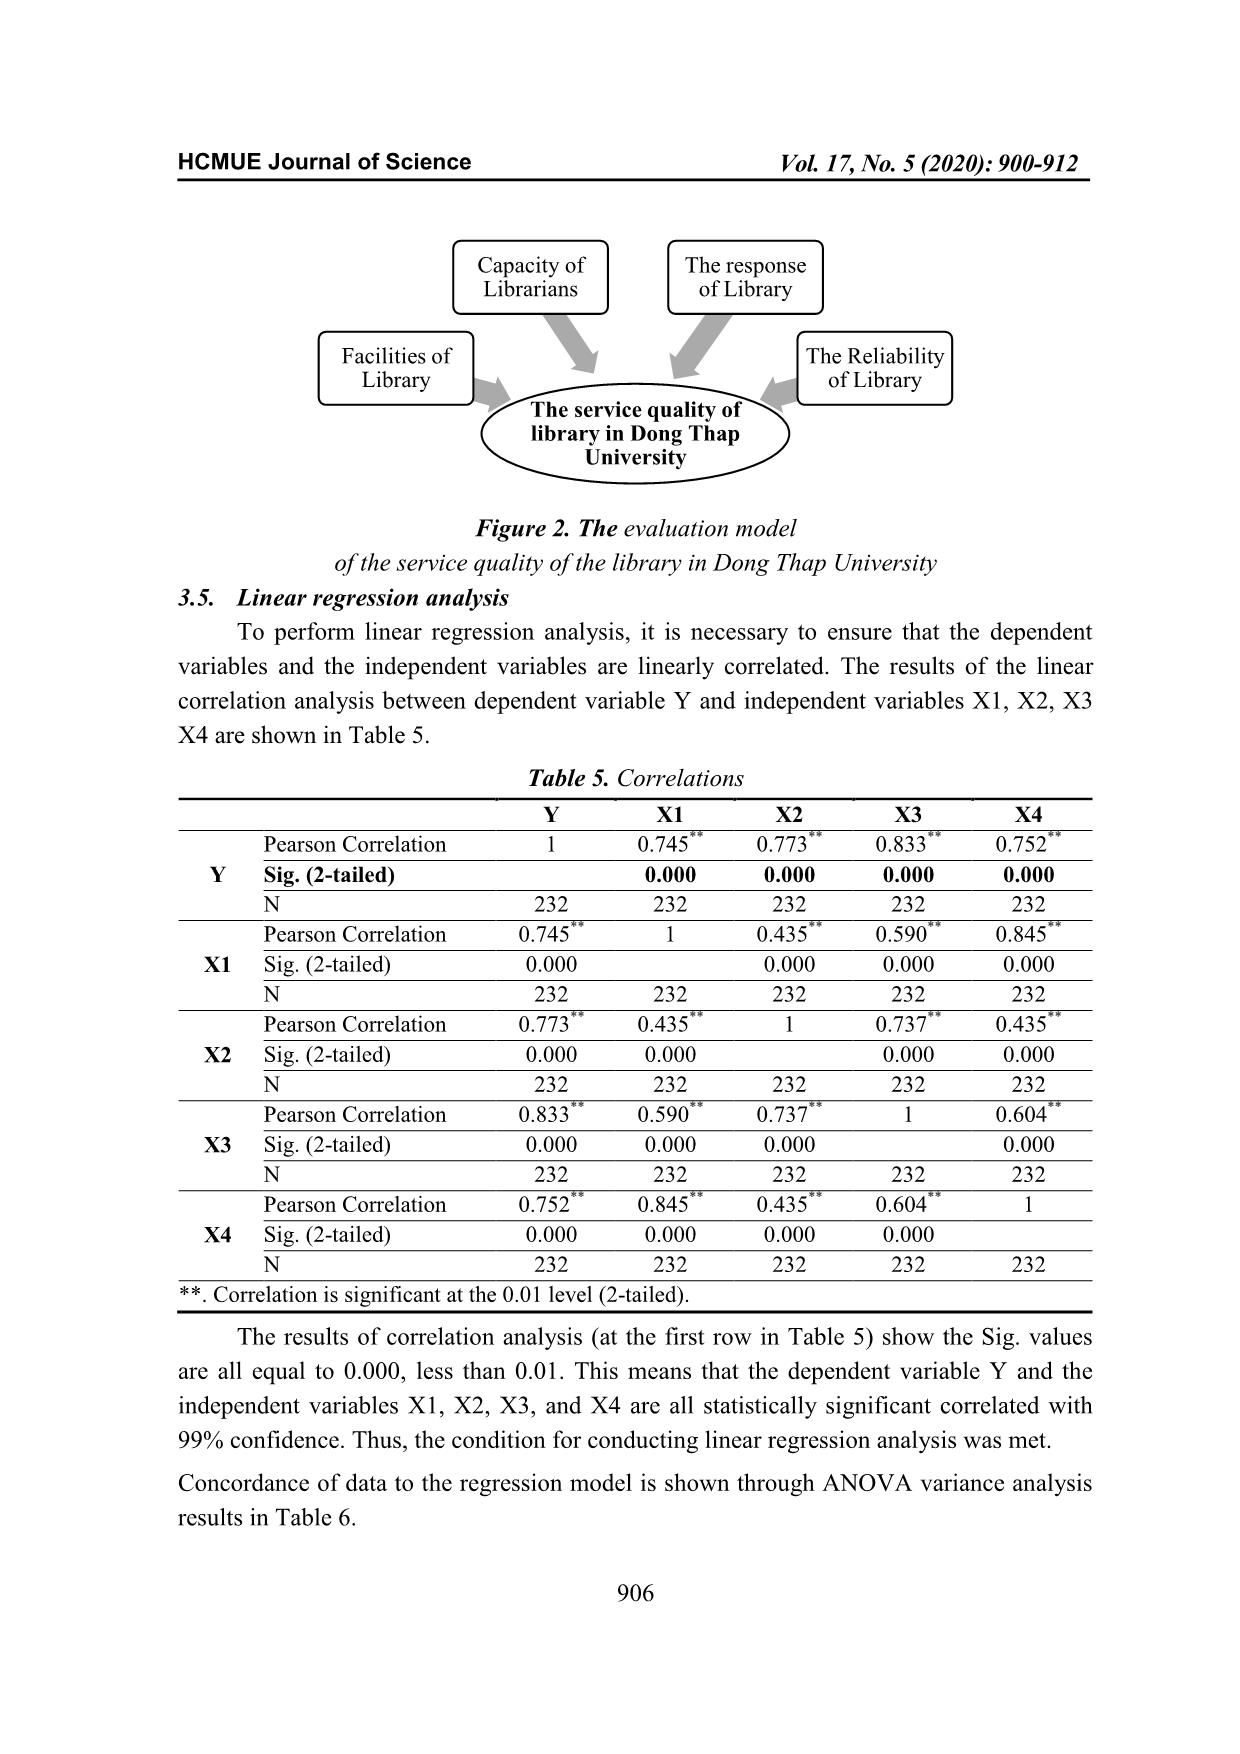
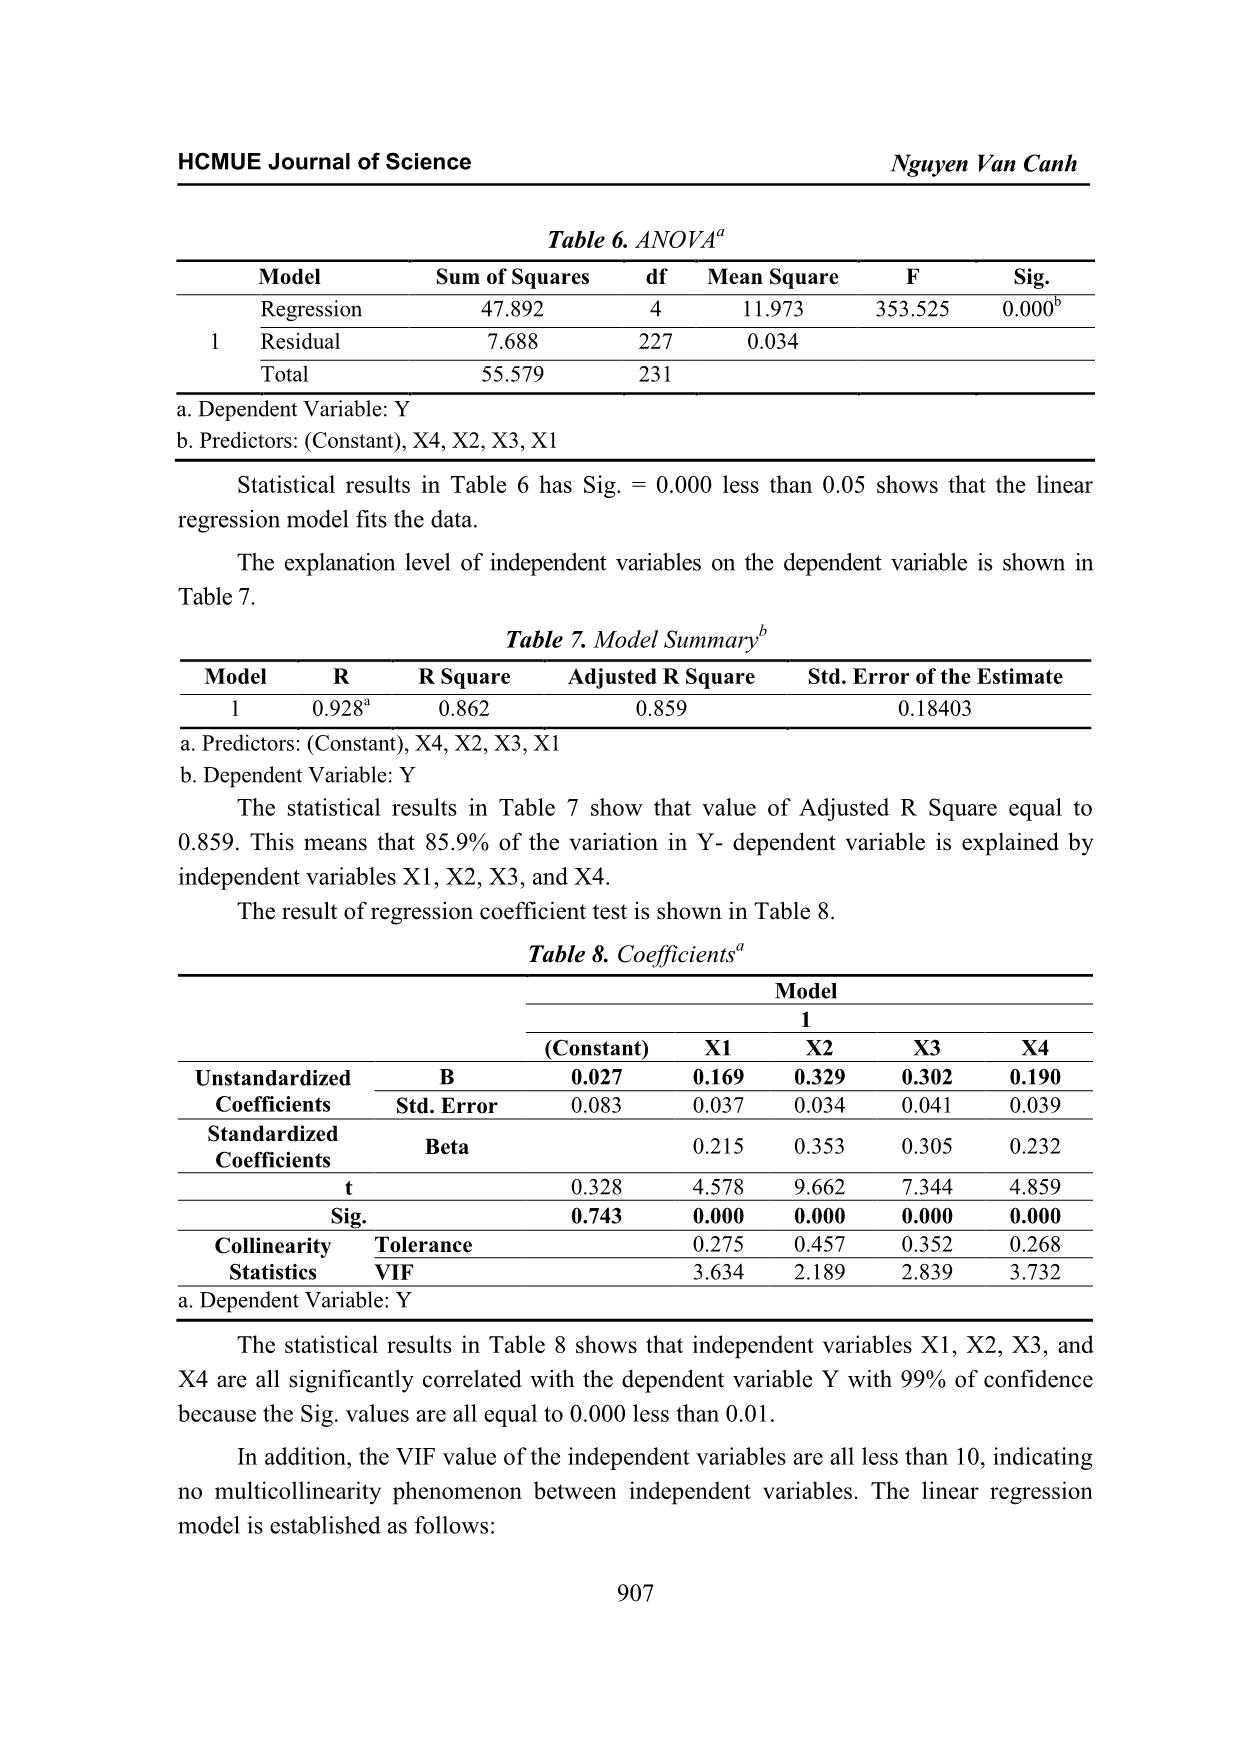
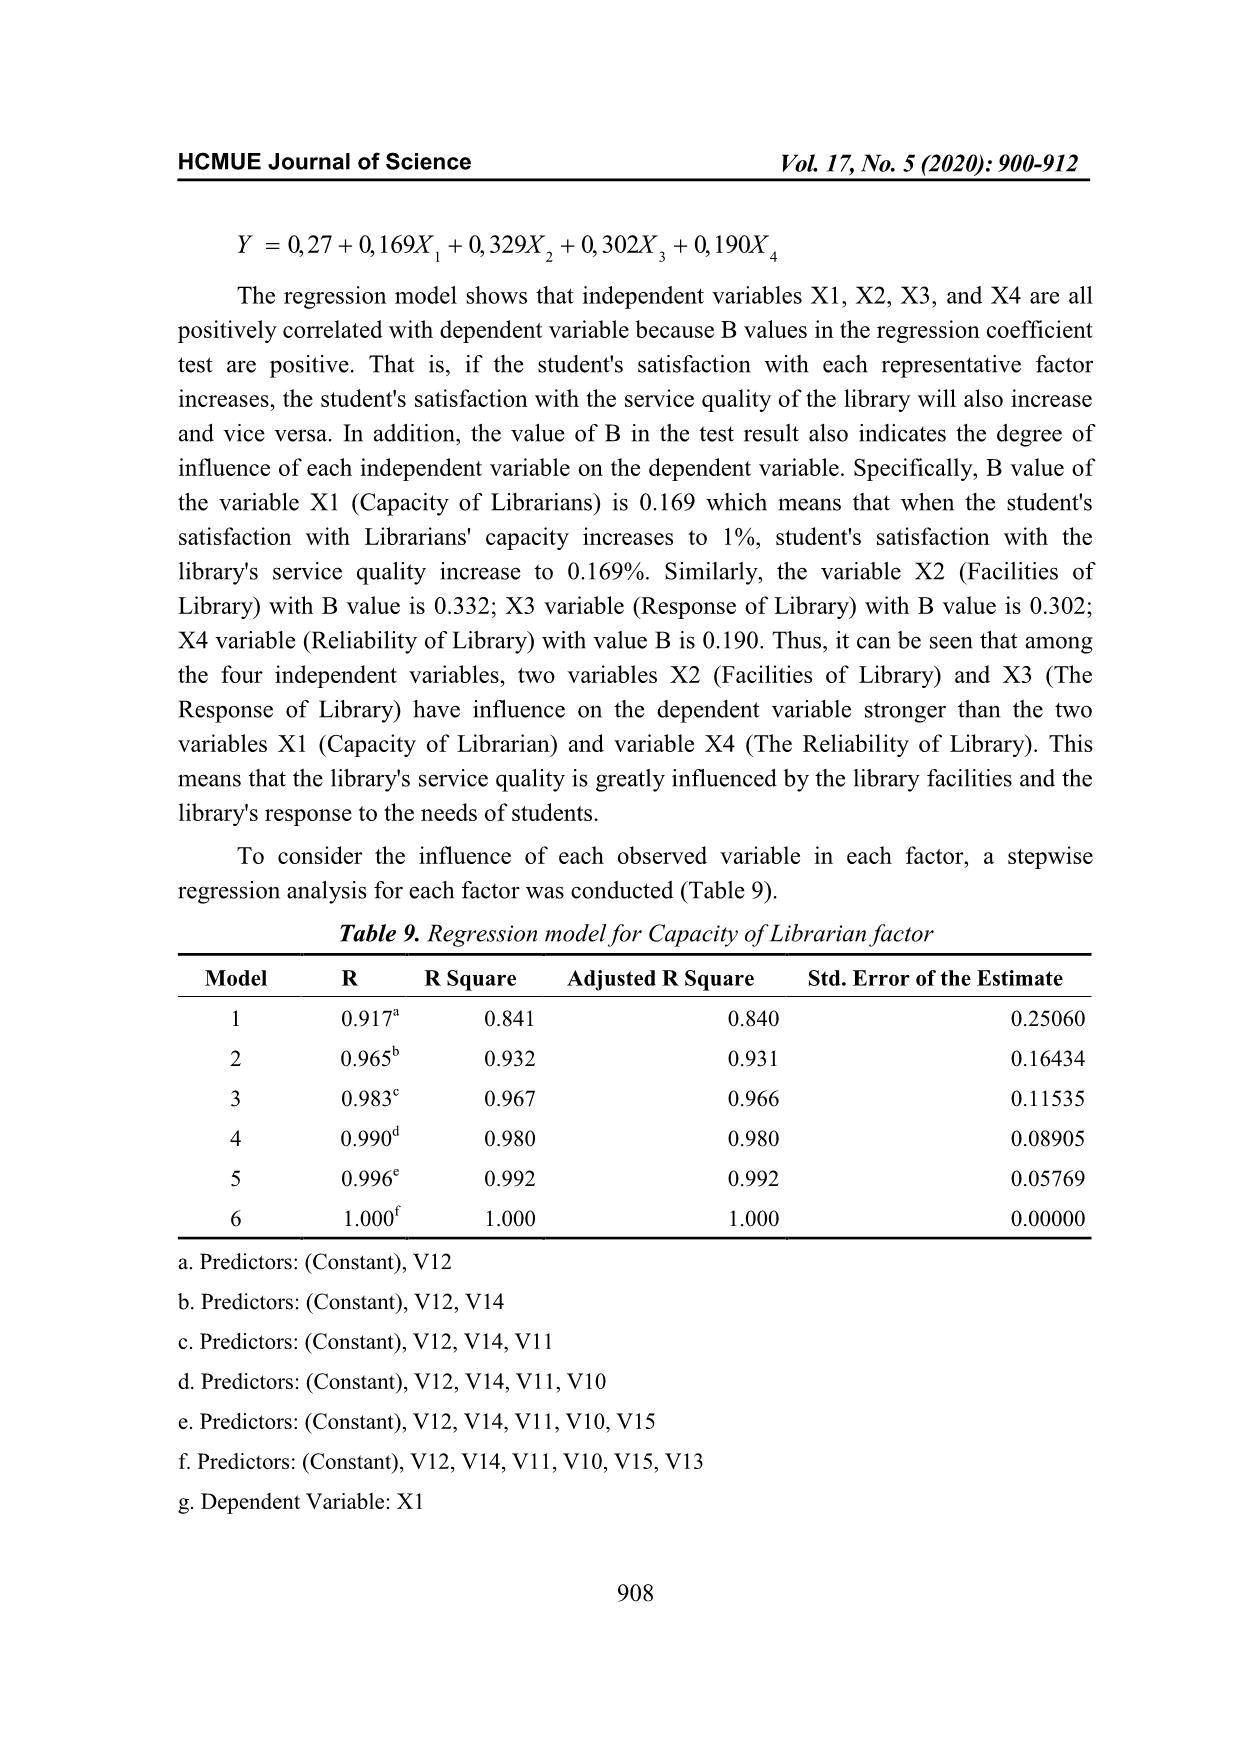
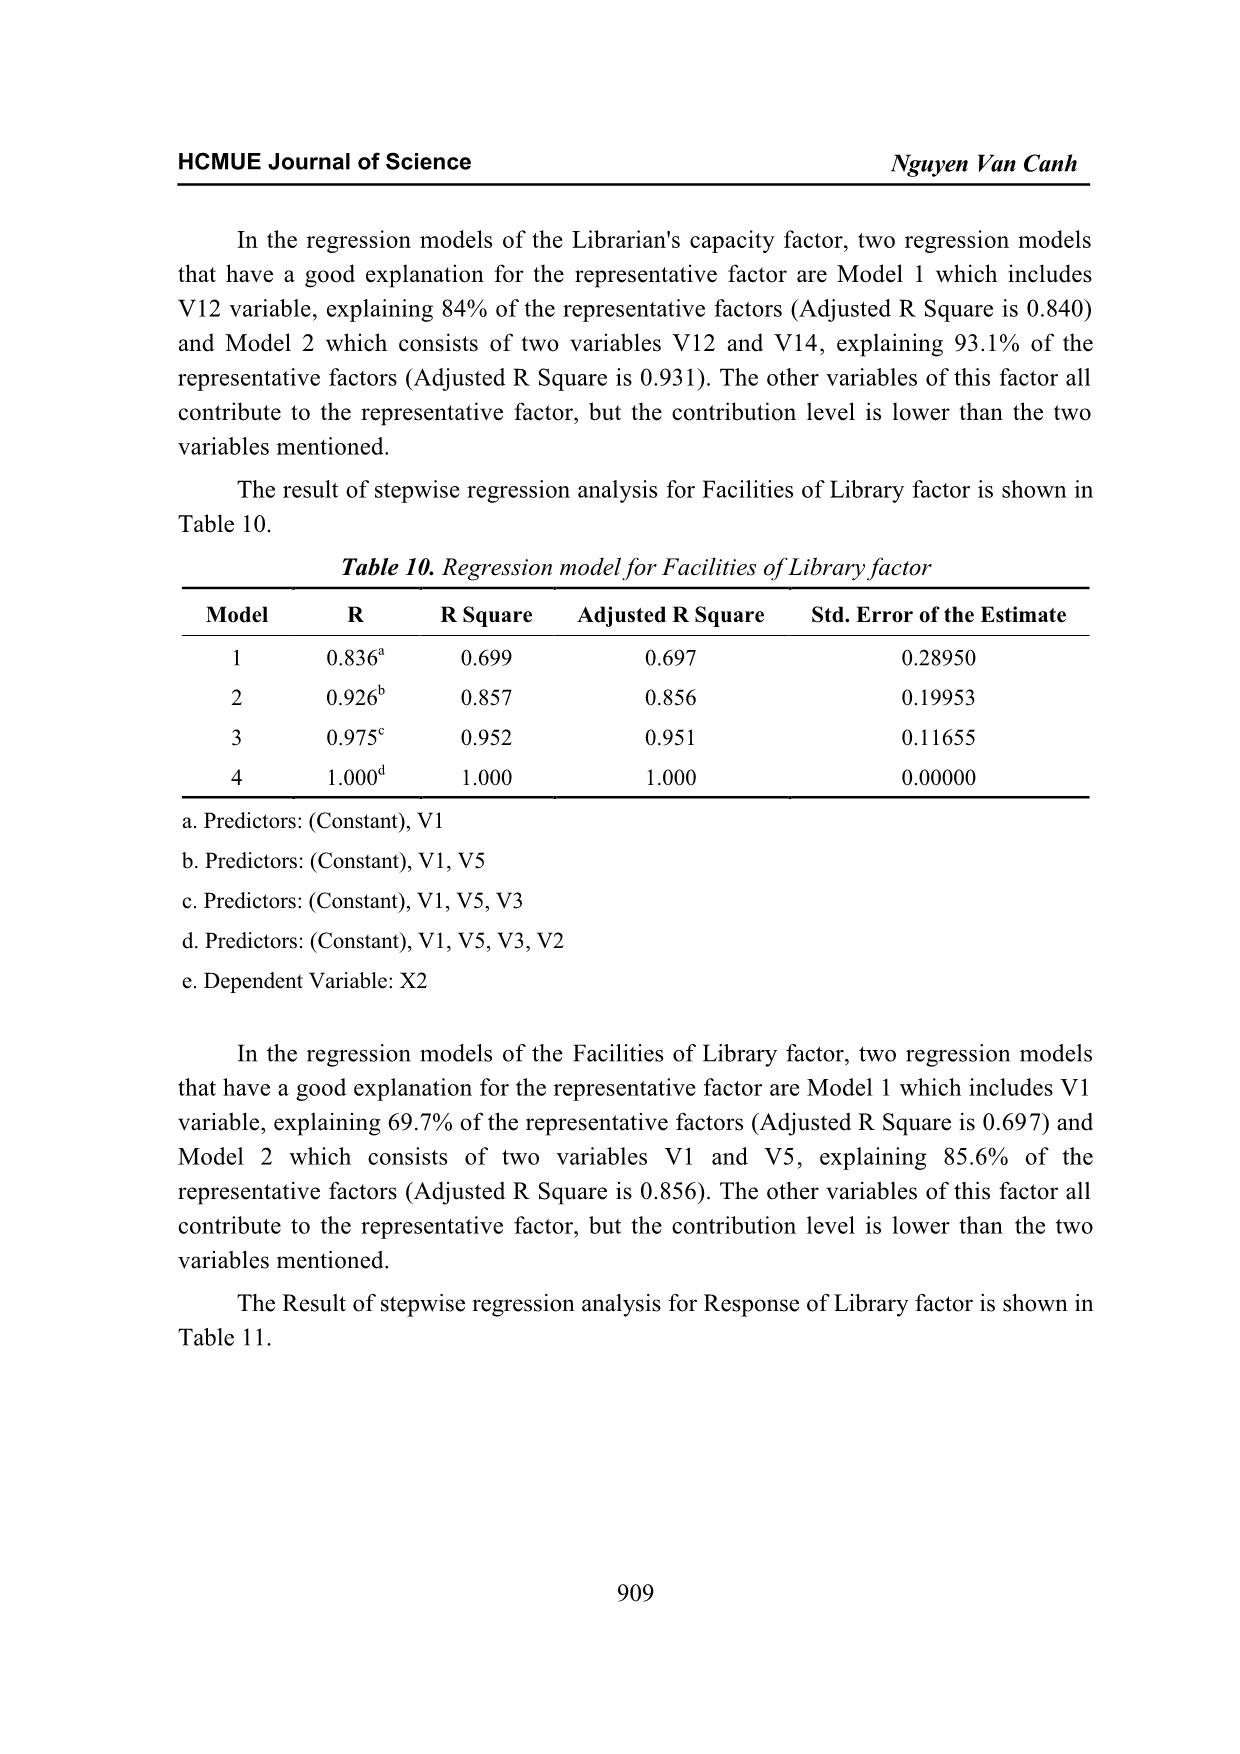
TẠP CHÍ KHOA HỌC TRƯỜNG ĐẠI HỌC SƯ PHẠM TP HỒ CHÍ MINH Tập 17, Số 5 (2020): 900-912 HO CHI MINH CITY UNIVERSITY OF EDUCATION JOURNAL OF SCIENCE Vol. 17, No. 5 (2020): 900-912 ISSN: 1859-3100 Website: 900 Research Article* EVALUATING THE QUALITY OF LIBRARY SERVICE IN DONG THAP UNIVERSITY Nguyen Van Canh Dong Thap University, Vietnam Corresponding author: Nguyen Van Canh – Email: nvcanh@dthu.edu.vn Received: April 02, 2020; Revised: April 20, 2020; Accepted: May 28, 2020 ABSTRACT This article presents the results of evaluating the service quality of library in Dong Thap University, which are based on the feedback of 232 students who are studying at the university and are directly using the library services. By using the Exploratory Factor Analysis method (EFA) and linear regression analysis methods, the study identifies four factors that affect the quality of library service and their impact level, including (1) Facilities of library, (2) Capacity of librarian, (3) Response of library, and (4) Reliability of library. In particular, the two factors that have a strong influence on the quality of library services are the library facilities and the library’s responsibility. In addition, the study also points out two observed variables corresponding to two contents of service quality which are meant to explain well to each factor. These are the major factors that greatly affect the quality of library services in Dong Thap University. Keywords: Dong Thap University; library; quality; service 1. Introduction At universities, libraries always play a very important role and are considered positive support places for teaching, learning and research activities of lecturers and students. Therefore, improving the service quality of library is one of the important tasks, contributing to enhancing the quality of training. A number of studies have shown a correlation between the quality of library service and students’ learning. Specifically, the higher the quality of the university's library service is, the higher the students’ learning results are (Alharbi & Middleton, 2012; Onuoha et al., 2013). In the current period, library in universities is not only merely to store books and reference materials but it also needs to provide the best services to students. To fulfill the library’s functions, the library needs to be equipped with modern facilities and has qualified staff to serve the users. In addition, Cite this article as: Nguyen Van Canh (2020). Evaluating the quality of library service in Dong Thap University. Ho Chi Minh City University of Education Journal of Science, 17(5), 900-912. HCMUE Journal of Science Nguyen Van Canh 901 the services of university libraries need to be evaluated by the users (Pedramnia et al., 2012). Along with other universities, Dong Thap University always considers to invest in library as one of the most important tasks and has made significant investments in the library of the university. In order to have data for timely adjustment and improvement, the evaluation of the service quality of library in Dong Thap University through student's feedback is necessary and has an important meaning to contribute for improving the training quality of the university. 2. Literature review 2.1. Service quality and customer satisfaction 2.1.1. Service quality Service quality is the level of difference between users’ expectations and their perception about the outcome of service (Parasuraman et al., 1988). According to this understanding, service quality is customer satisfaction measured by the difference between the expected quality and the achieved quality, that is, if the achieved quality is equal or higher than the expected quality then the service quality will be guaranteed. Therefore, the measurement of service quality is usually based on the relationship between customers’ expectations and their actual perception about the service (Nguyen, 2005). In universities, the library is considered a source of great knowledge for teachers and students. Traditionally, the library quality is measured by the collection of books and newspapers, the size or capacity of a library, and the statistics about the number of library users (Sahu, 2007). This view ignores the needs of information that library users usually desire. With the trend of library modernization, the library quality is also reflected in the number of digitized electronic documents that help free up storage space and close the geographical distance between libraries and users. A research by Thomson et al. (2002) shows that the service quality of library includes four factors: service capacity, library space, information resources, and access to information. Thus, the quality of library service is to meet the expectations of lecturers and students in the use of library services. 2.1.2. Customer satisfaction S ... 0.000 0.000 N 232 232 232 232 232 X2 Pearson Correlation 0.773 ** 0.435 ** 1 0.737 ** 0.435 ** Sig. (2-tailed) 0.000 0.000 0.000 0.000 N 232 232 232 232 232 X3 Pearson Correlation 0.833 ** 0.590 ** 0.737 ** 1 0.604 ** Sig. (2-tailed) 0.000 0.000 0.000 0.000 N 232 232 232 232 232 X4 Pearson Correlation 0.752 ** 0.845 ** 0.435 ** 0.604 ** 1 Sig. (2-tailed) 0.000 0.000 0.000 0.000 N 232 232 232 232 232 **. Correlation is significant at the 0.01 level (2-tailed). The results of correlation analysis (at the first row in Table 5) show the Sig. values are all equal to 0.000, less than 0.01. This means that the dependent variable Y and the independent variables X1, X2, X3, and X4 are all statistically significant correlated with 99% confidence. Thus, the condition for conducting linear regression analysis was met. Concordance of data to the regression model is shown through ANOVA variance analysis results in Table 6. The service quality of library in Dong Thap University Facilities of Library Capacity of Librarians The response of Library The Reliability of Library HCMUE Journal of Science Nguyen Van Canh 907 Table 6. ANOVA a Model Sum of Squares df Mean Square F Sig. 1 Regression 47.892 4 11.973 353.525 0.000 b Residual 7.688 227 0.034 Total 55.579 231 a. Dependent Variable: Y b. Predictors: (Constant), X4, X2, X3, X1 Statistical results in Table 6 has Sig. = 0.000 less than 0.05 shows that the linear regression model fits the data. The explanation level of independent variables on the dependent variable is shown in Table 7. Table 7. Model Summary b Model R R Square Adjusted R Square Std. Error of the Estimate 1 0.928 a 0.862 0.859 0.18403 a. Predictors: (Constant), X4, X2, X3, X1 b. Dependent Variable: Y The statistical results in Table 7 show that value of Adjusted R Square equal to 0.859. This means that 85.9% of the variation in Y- dependent variable is explained by independent variables X1, X2, X3, and X4. The result of regression coefficient test is shown in Table 8. Table 8. Coefficients a Model 1 (Constant) X1 X2 X3 X4 Unstandardized Coefficients B 0.027 0.169 0.329 0.302 0.190 Std. Error 0.083 0.037 0.034 0.041 0.039 Standardized Coefficients Beta 0.215 0.353 0.305 0.232 t 0.328 4.578 9.662 7.344 4.859 Sig. 0.743 0.000 0.000 0.000 0.000 Collinearity Statistics Tolerance 0.275 0.457 0.352 0.268 VIF 3.634 2.189 2.839 3.732 a. Dependent Variable: Y The statistical results in Table 8 shows that independent variables X1, X2, X3, and X4 are all significantly correlated with the dependent variable Y with 99% of confidence because the Sig. values are all equal to 0.000 less than 0.01. In addition, the VIF value of the independent variables are all less than 10, indicating no multicollinearity phenomenon between independent variables. The linear regression model is established as follows: HCMUE Journal of Science Vol. 17, No. 5 (2020): 900-912 908 The regression model shows that independent variables X1, X2, X3, and X4 are all positively correlated with dependent variable because B values in the regression coefficient test are positive. That is, if the student's satisfaction with each representative factor increases, the student's satisfaction with the service quality of the library will also increase and vice versa. In addition, the value of B in the test result also indicates the degree of influence of each independent variable on the dependent variable. Specifically, B value of the variable X1 (Capacity of Librarians) is 0.169 which means that when the student's satisfaction with Librarians' capacity increases to 1%, student's satisfaction with the library's service quality increase to 0.169%. Similarly, the variable X2 (Facilities of Library) with B value is 0.332; X3 variable (Response of Library) with B value is 0.302; X4 variable (Reliability of Library) with value B is 0.190. Thus, it can be seen that among the four independent variables, two variables X2 (Facilities of Library) and X3 (The Response of Library) have influence on the dependent variable stronger than the two variables X1 (Capacity of Librarian) and variable X4 (The Reliability of Library). This means that the library's service quality is greatly influenced by the library facilities and the library's response to the needs of students. To consider the influence of each observed variable in each factor, a stepwise regression analysis for each factor was conducted (Table 9). Table 9. Regression model for Capacity of Librarian factor Model R R Square Adjusted R Square Std. Error of the Estimate 1 0.917 a 0.841 0.840 0.25060 2 0.965 b 0.932 0.931 0.16434 3 0.983 c 0.967 0.966 0.11535 4 0.990 d 0.980 0.980 0.08905 5 0.996 e 0.992 0.992 0.05769 6 1.000 f 1.000 1.000 0.00000 a. Predictors: (Constant), V12 b. Predictors: (Constant), V12, V14 c. Predictors: (Constant), V12, V14, V11 d. Predictors: (Constant), V12, V14, V11, V10 e. Predictors: (Constant), V12, V14, V11, V10, V15 f. Predictors: (Constant), V12, V14, V11, V10, V15, V13 g. Dependent Variable: X1 1 2 3 4 0,27 0,169 0, 329 0, 302 0,190Y X X X X HCMUE Journal of Science Nguyen Van Canh 909 In the regression models of the Librarian's capacity factor, two regression models that have a good explanation for the representative factor are Model 1 which includes V12 variable, explaining 84% of the representative factors (Adjusted R Square is 0.840) and Model 2 which consists of two variables V12 and V14, explaining 93.1% of the representative factors (Adjusted R Square is 0.931). The other variables of this factor all contribute to the representative factor, but the contribution level is lower than the two variables mentioned. The result of stepwise regression analysis for Facilities of Library factor is shown in Table 10. Table 10. Regression model for Facilities of Library factor Model R R Square Adjusted R Square Std. Error of the Estimate 1 0.836 a 0.699 0.697 0.28950 2 0.926 b 0.857 0.856 0.19953 3 0.975 c 0.952 0.951 0.11655 4 1.000 d 1.000 1.000 0.00000 a. Predictors: (Constant), V1 b. Predictors: (Constant), V1, V5 c. Predictors: (Constant), V1, V5, V3 d. Predictors: (Constant), V1, V5, V3, V2 e. Dependent Variable: X2 In the regression models of the Facilities of Library factor, two regression models that have a good explanation for the representative factor are Model 1 which includes V1 variable, explaining 69.7% of the representative factors (Adjusted R Square is 0.697) and Model 2 which consists of two variables V1 and V5, explaining 85.6% of the representative factors (Adjusted R Square is 0.856). The other variables of this factor all contribute to the representative factor, but the contribution level is lower than the two variables mentioned. The Result of stepwise regression analysis for Response of Library factor is shown in Table 11. HCMUE Journal of Science Vol. 17, No. 5 (2020): 900-912 910 Table 11. Regression model for Response of Library factor Model R R Square Adjusted R Square Std. Error of the Estimate 1 0.813 a 0.660 0.659 0.29010 2 0.901 b 0.812 0.810 0.21652 3 0.951 c 0.904 0.903 0.15484 4 0.983 d 0.967 0.966 0.09099 5 1.000 e 1.000 1.000 0.00000 a. Predictors: (Constant), V7 b. Predictors: (Constant), V7, V9 c. Predictors: (Constant), V7, V9, V4 d. Predictors: (Constant), V7, V9, V4, V8 e. Predictors: (Constant), V7, V9, V4, V8, V6 f. Dependent Variable: X3 In the regression models of Library's Response factor, two regression models that have a good explanation for the representative factor are Model 1 which includes V7 variable explain 69.7% of the representative factors (Adjusted R Square is 0.697) and Model 2 which consists of two variables V1 and C5, explaining 85.6% of the representative factors (Adjusted R Square is 0.856). The other variables of this factor all contribute to the representative factor, but the contribution level is lower than the two variables mentioned. The result of stepwise regression analysis for Reliability of Library factor is shown in Table 12. Table 12. Regression model for The Reliability of Library Model R R Square Adjusted R Square Std. Error of the Estimate 1 0.920 a 0.847 0.846 0.23444 2 0.971 b 0.942 0.942 0.14414 3 0.989 c 0.977 0.977 0.09088 4 1.000 d 1.000 1.000 0.00000 a. Predictors: (Constant), V18 b. Predictors: (Constant), V18, V17 c. Predictors: (Constant), V18, V17, V16 d. Predictors: (Constant), V18, V17, V16, V19 e. Dependent Variable: X4 In the regression models of Library's Reliability factor, two regression models that have a good explanation for the representative factor are Model 1 which includes V18 variable, explaining 84.6% of the representative factors (Adjusted R Square is 0.846) and Model 2 which consists of two variables V18 and V17, explaining 94.2% of the representative factors (Adjusted R Square is 0.942). The other variables of this factor all HCMUE Journal of Science Nguyen Van Canh 911 contribute to the representative factor, but the contribution level is lower than the two variables mentioned. 4. Conclusion Using the Exploratory Factor Analysis method, the study has identified four factors that affect the service quality of the library in Dong Thap University, including (1) Facilities of Library, (2) Capacity of Librarians, (3) Response of Library, and (4) Reliability of Library. In addition, by linear regression analysis method, the research shows the influence of each factor on the quality of library service. In particular, two factors that have a strong influence on the quality of the library services are the Library facilities and the Library Responsibility. In addition, in each factor, the study also points out the two observed variables that are meant to explain well to the representative factor. Those are the variables V12 - Librarians always support students with dedication and enthusiasm and V14 - Librarians care about students' benefits for Capacity of the librarians; variables V1 - The number of books and reference materials in the borrowing room is sufficient, V5 - Tables and chairs for readers at the library are modern, and arranged scientifically for Facilities of Library factor; variables V7 - Books and reference materials are arranged systematically, V9 - The number of books allows to be borrowed each time meets the student's needs for Response of Library factor; variable V18 - Librarians always follow what they promised, V17 - Librarians do not make any error during serving students for Reliability of Library factor. These are the major factors that greatly affect the service quality of the library. Therefore, in order to improve the quality of services, the library of Dong Thap University needs to pay attention to these factors to bring the best quality of service. Conflict of Interest: Author have no conflict of interest to declare. REFERENCES Alharbi, A., & Middleton, M. (2012). The relationship between academic library usage and educational performance in Kuwait. Library Management. Brady, M. K., Cronin Jr, J. J., & Brand, R. R. (2002). Performance-only measurement of service quality: a replication and extension. Journal of business research, 55(1), 17-31. Cronin Jr, J. J., & Taylor, S. A. (1992). Measuring service quality: a reexamination and extension. Journal of marketing, 56(3), 55-68. Hoang, T., & Chu, N. M. N. (2008). Phan tich du lieu nghien cuu voi SPSS [Analyze research data with SPSS]. Hanoi: Hong Duc Publishing House. Isleem, M. I. (2003). Relationships of selected factors and the level of computer use for instructional purposes by technology education teachers in Ohio public schools: a statewide survey (Doctoral dissertation, The Ohio State University). Kotler, P., & Armstrong, G. (2010). Principles of marketing. Pearson education. HCMUE Journal of Science Vol. 17, No. 5 (2020): 900-912 912 Lee, J. & Feick, L. (2001). The Impact of Switching Cost on the Customer Satisfaction Loyalty Link: Mobile phone Service in France. Journal of Service Marketing, 15(1), 35-48. Nguyen, D. P. (2005). Quan li chat luong trong cac to chuc [Quality management in organizations]. Hanoi: Labour and Social Publishing House. Ojo, O. (2010). The relationship between service quality and customer satisfaction in the telecommunication industry: Evidence from Nigeria. BRAND. Broad Research in Accounting, Negotiation, and Distribution, 1(1), 88-100. Onuoha, U. D., Ikonne, C. N., & Madukoma, E. (2013). Perceived impact of library use on the research productivity of postgraduate students at Babcock University, Nigeria. Journal of Research and Method in Education, 1(1), 11-16. Parasuraman, A., Zeithaml, V. A., & Berry, L. L. (1988). Servqual: A multiple-item scale for measuring consumer perc. Journal of retailing, 64(1), 12-40. Pedramnia, S., Modiramani, P., & Ghanbarabadi, V. G. (2012). An analysis of service quality in academic libraries using LibQUAL scale. Library Management. Sahu, A. K. (2007). Measuring service quality in an academic library: An Indian case study. Library review. Thompson, B., Cook, C., & Thompson, R. L. (2002). Reliability and structure of LibQUAL+ scores: Measuring perceived library service quality. portal: Libraries and the Academy, 2(1), 3-12. ĐÁNH GIÁ CHẤT LƯỢNG DỊCH VỤ CỦA THƯ VIỆN TRƯỜNG ĐẠI HỌC ĐỒNG THÁP Nguyễn Văn Cảnh Trường Đại học Đồng Tháp, Việt Nam Tác giả liên hệ: Nguyễn Văn Cảnh – Email: nvcanh@dthu.edu.vn Ngày nhận bài: 02-4-2020; ngày nhận bài sửa: 20-4-2020, ngày chấp nhận đăng: 28-5-2020 TÓM TẮT Bài viết trình bày kết quả đánh giá chất lượng dịch vụ của thư viện Trường Đại học Đồng Tháp dựa trên phản hồi của 232 sinh viên đang học tập tại trường và trực tiếp sử dụng dịch vụ của thư viện. Bằng phương pháp phân tích nhân tố khám phá EFA và các phương pháp phân tích hồi quy tuyến tính, nghiên cứu đã chỉ ra bốn nhân tố có ảnh hưởng đến chất lượng dịch vụ của thư viện và mức độ ảnh hưởng của các nhân tố đó, bao gồm: (1) Cơ sở vật chất, (2) Năng lực của đội ngũ nhân viên, (3) Sự đáp ứng của thư viện và (4) Sự tin cậy của thư viện. Trong đó, hai nhân tố có ảnh hưởng mạnh đến chất lượng dịch vụ của thư viện là cơ sở vật chất và sự đáp ứng của thư viện. Bên cạnh đó, nghiên cứu cũng đã chỉ ra hai biến quan sát tương ứng với hai nội dung về chất lượng dịch vụ có ý nghĩa giải thích tốt cho mỗi nhân tố. Đây là những yếu tố quan trọng, có ảnh hưởng lớn đến chất lượng dịch vụ của thư viện Trường Đại học Đồng Tháp. Từ khóa: Đại học Đồng Tháp; thư viện; chất lượng; dịch vụ
File đính kèm:
 evaluating_the_quality_of_library_service_in_dong_thap_unive.pdf

