Validation of predictive equations against DXA for estimation of body fat composition in Vietnamese children
Abstract: Background: Childhood overweight and obesity are becoming more pronounced in Vietnam, so an
assessment tool of high efficiency in the community is warranted. This study sought to validate skinfold
thickness (SFT) equations for estimation of body fatness by Goran and Slaughter against DXA to aid in
assessing obesity. Method: A cross-sectional study was conducted on 144 healthy children (ages 6-17) who
were conveniently sampled from schools within an urban district. Their anthropometric measurements (height,
weight, and SFT) and DXA whole-body results were taken to record body fat percentage (BF%). Bland-Altman
analysis and correlation between bias and body fat were employed to understand the agreement between results
from each equation and DXA whole body. Result: BF% was 32.2 ± 7.6% (mean ± SD). 52.8% of the children
were overweight or obese. Bland-Altman plots showed that all four SFT equations had wide limits of agreement
(LOAs) and largely underestimated the reference BF% by up to 8.90%. Goran equation predicted better when
BF% decreased, whereas Slaughter equations produced less bias when there was more body fat. Conclusion:
The prevalence rate of overweight and obesity has become alarming. Besides, Goran and Slaughter equations
cannot be used as alternatives for DXA scanning to measure body fat due to their underestimation.
Trang 1
Trang 2
Trang 3
Trang 4
Trang 5
Tóm tắt nội dung tài liệu: Validation of predictive equations against DXA for estimation of body fat composition in Vietnamese children
 MedPharmRes, 2020, 4 11
*Address correspondence to Thanh V. Kim at Department of Epidemiology,
Faculty of Public Health, Pham Ngoc Thach University of Medicine, Ho Chi
Minh City 70000, Vietnam; E-mails: thanhkv@pnt.edu.vn.
DOI: 10.32895/UMP.MPR.4.2.2
 © 2020 MedPharmRes
MedPharmRes
journal of University of Medicine and Pharmacy at Ho Chi Minh City
homepage:  and
Original article
Validation of predictive equations against DXA for estimation of body fat
composition in Vietnamese children
Thanh V. Kima*, Tam M. Doa, Thanh T.K. Trana, Xuan M. Ngob, Hong K. Tanga
aDepartment of Epidemiology, Faculty of Public Health, Pham Ngoc Thach University of Medicine, Ho Chi Minh City
70000, Vietnam;
bPham Ngoc Thach University of Medicine, Ho Chi Minh City 70000, Vietnam.
Received February 05, 2020: Revised March 26, 2020: Accepted April 20, 2020
Abstract: Background: Childhood overweight and obesity are becoming more pronounced in Vietnam, so an
assessment tool of high efficiency in the community is warranted. This study sought to validate skinfold
thickness (SFT) equations for estimation of body fatness by Goran and Slaughter against DXA to aid in
assessing obesity. Method: A cross-sectional study was conducted on 144 healthy children (ages 6-17) who
were conveniently sampled from schools within an urban district. Their anthropometric measurements (height,
weight, and SFT) and DXA whole-body results were taken to record body fat percentage (BF%). Bland-Altman
analysis and correlation between bias and body fat were employed to understand the agreement between results
from each equation and DXA whole body. Result: BF% was 32.2 ± 7.6% (mean ± SD). 52.8% of the children
were overweight or obese. Bland-Altman plots showed that all four SFT equations had wide limits of agreement
(LOAs) and largely underestimated the reference BF% by up to 8.90%. Goran equation predicted better when
BF% decreased, whereas Slaughter equations produced less bias when there was more body fat. Conclusion:
The prevalence rate of overweight and obesity has become alarming. Besides, Goran and Slaughter equations
cannot be used as alternatives for DXA scanning to measure body fat due to their underestimation.
Keywords: Validation; predictive equation; body fat.
1. INTRODUCTION
While high-income countries have struggled against
obesity epidemic, countries at lower end of SDI
(socialdemographic index) levels witnessed a significant
increase childhood obesity [1]. Notably in Vietnam, 2014-
2015 surveillance of the National Institute of Nutrition
showed nearly one in two urban children were obese [2]. Once
a child becomes overweight or obese, he or she is more likely
to maintain this condition to adulthood [3, 4]. Furthermore,
this condition may lead to chronic diseases for these children
when they grow up [5-7]. Currently, health professionals most
depend on BMI to diagnose this condition although concerns
have been raised about this index’s validity [8, 9]. Hence,
other alternatives have been developed. Until now, the use of
adiposity for diagnosing childhood obesity is increasingly
endorsed by contemporary literature [8-12].
DXA is becoming a reference method to measure body fat
[13]. However, due to logistic and financial limitations,
technical complexity and concerns for radiation, it is not
feasible to use DXA widely and routinely on the field.
Therefore, scores of equations using anthropometric
characteristics were developed to estimate body fat
percentage because of the usefulness of these measures in
various settings, especially at the primary care level. In
12 MedPharmRes, 2020, Vol. 4, No. 2 Kim et al.
children, they include famous equations developed by
Slaughter or Goran [14, 15]. These predictive equations were
built upon specific populations and need validating on other
populations before being used. So far, to our best knowledge,
little or no previous studies have confirmed the validity of
these equations on Vietnamese children.
The present study primarily aimed to validate current
predictive equations against DXA on children from 6 to 17
years of age currently living in Ho Chi Minh city. The
secondary aim was to describe the anthropometric
characteristics of the same population.
2. MATERIALS AND METHOD
2.1. Study design and sample
This cross-sectional study recruited 144 children of
normal health (72 boys and 72 girls) aged 6 – 17. They were
conveniently sampled from 5 schools (2 elementary, 2
secondary and 1 high school) in District 10 of Ho Chi Minh
City during the 2018 – 2019 period. The eligibility criteria
were children from 6 – 17 years of age, not having any acute
or chronic illnesses nor using any medications which were
related to the alteration in body composition.
2.2. Anthropometric measurements
The research team came to the schools to collect
anthropometric data according ... d [19].
2.6. Ethics
The study was conducted under the ethic approval from
Pham Ngoc Thach University of Medicine. We gave the
parents a written consent form to sign up for participation after
they were informed of information related to the study.
3. RESULTS
3.1. Participants’ characteristics
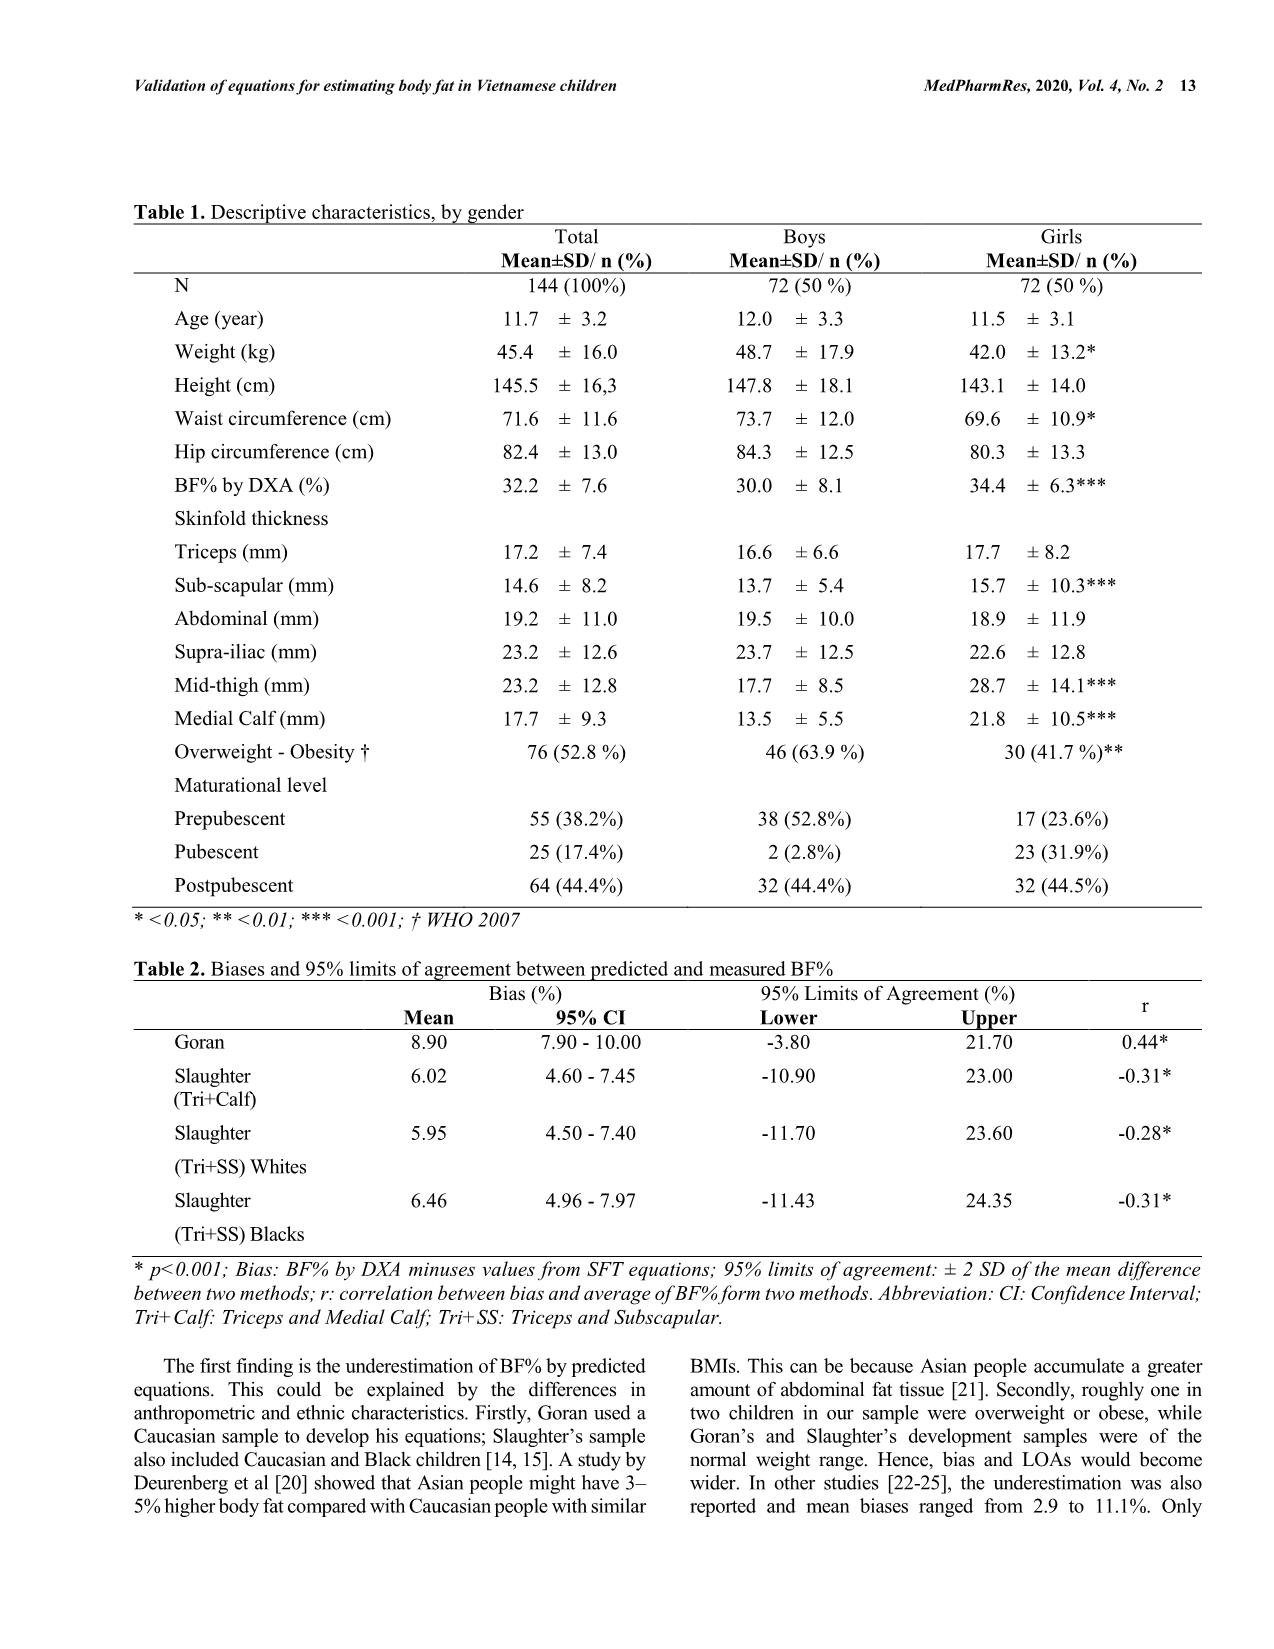
Data from Table 1 show descriptive data from participants
aged between 6 and 17. More than half were overweight or obese.
Moreover, though boys had significantly lower body fat, more of
them were obese than girls. Nearly half of the children were in
post-puberty.
3.2. Agreement between predicted and measured BF%
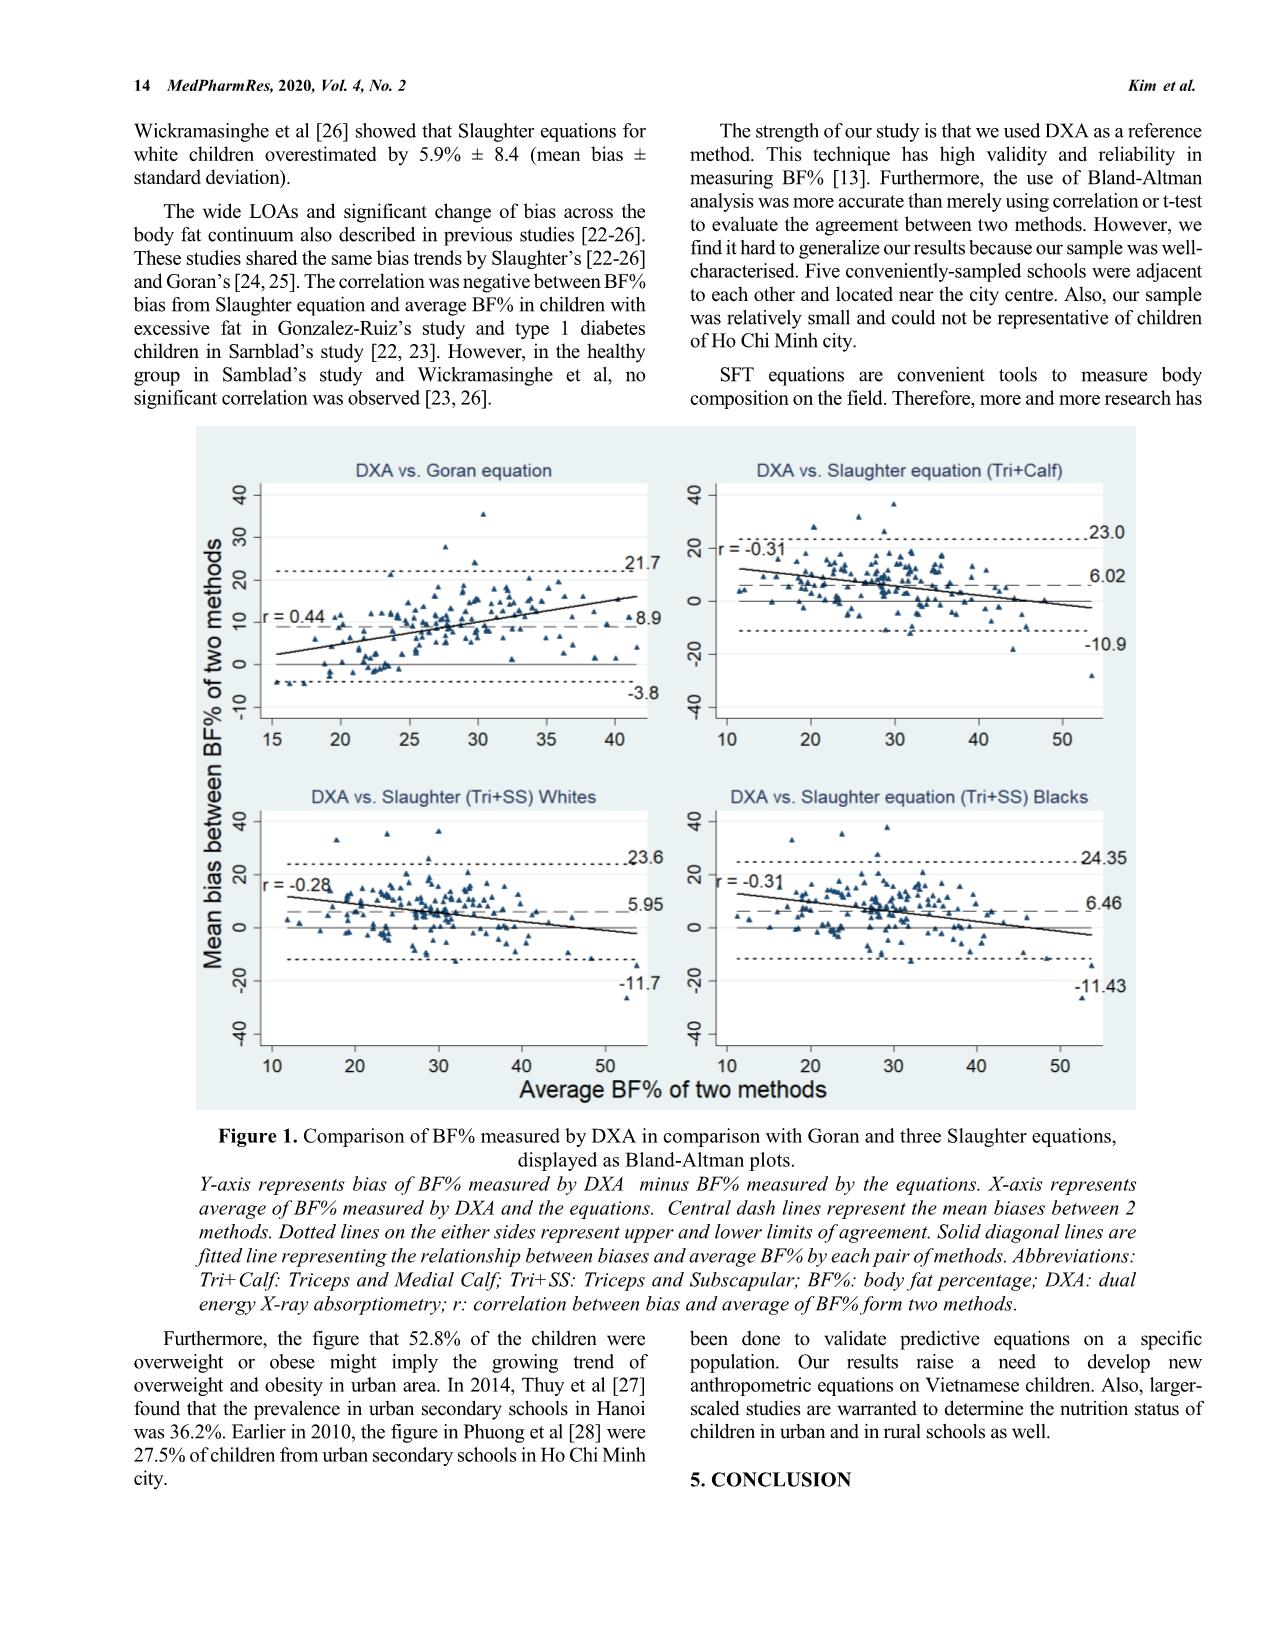
In Table 2, the significant biases between the two methods
show that the four SFT equations underestimated the reference
BF%. The 95% LOAs were wide with the gap fluctuating from
25.50% (Goran’s) to 35.78% (Slaughter’s). Although the bias
from Goran equations was the most pronounced, its LOAs was
the narrowest. Furthermore, the correlation degree between bias
and average BF% from DXA and each equation was weak to
moderate, indicating the bias significantly changed across the
body fat continuum (Figure 1). Specifically, as for the three
Slaughter equations, the more body fat, the lower the bias.
Conversely, the bias from Goran equation became larger when
children had more body fat.
4. DISCUSSION
In this study, we found that Goran and three Slaughter SFT
equations underestimated the BF% measured by DXA scans.
Also, the difference computed by Goran equation was larger
when the child has more body fat. Conversely, with three
Slaughter equations, the difference yielded was larger when a
child has less body fat. Therefore, we cannot use these equations
as a replacement for DXA. We also learnt that the proportion of
children with overweight or obesity had gone up to 52.8%; BF%
was 32.2 ± 7.6 %. As far as we can tell, this is the first study in
Vietnam to validate predictive equations against DXA scans with
the latest nutritional status data from children in Ho Chi Minh
city.
Validation of equations for estimating body fat in Vietnamese children MedPharmRes, 2020, Vol. 4, No. 2 13
Table 1. Descriptive characteristics, by gender
 Total Boys Girls
 Mean±SD/ n (%) Mean±SD/ n (%) Mean±SD/ n (%)
N 144 (100%) 72 (50 %) 72 (50 %)
Age (year) 11.7 ± 3.2 12.0 ± 3.3 11.5 ± 3.1
Weight (kg) 45.4 ± 16.0 48.7 ± 17.9 42.0 ± 13.2*
Height (cm) 145.5 ± 16,3 147.8 ± 18.1 143.1 ± 14.0
Waist circumference (cm) 71.6 ± 11.6 73.7 ± 12.0 69.6 ± 10.9*
Hip circumference (cm) 82.4 ± 13.0 84.3 ± 12.5 80.3 ± 13.3
BF% by DXA (%) 32.2 ± 7.6 30.0 ± 8.1 34.4 ± 6.3***
Skinfold thickness
Triceps (mm) 17.2 ± 7.4 16.6 ± 6.6 17.7 ± 8.2
Sub-scapular (mm) 14.6 ± 8.2 13.7 ± 5.4 15.7 ± 10.3***
Abdominal (mm) 19.2 ± 11.0 19.5 ± 10.0 18.9 ± 11.9
Supra-iliac (mm) 23.2 ± 12.6 23.7 ± 12.5 22.6 ± 12.8
Mid-thigh (mm) 23.2 ± 12.8 17.7 ± 8.5 28.7 ± 14.1***
Medial Calf (mm) 17.7 ± 9.3 13.5 ± 5.5 21.8 ± 10.5***
Overweight - Obesity † 76 (52.8 %) 46 (63.9 %) 30 (41.7 %)**
Maturational level
Prepubescent 55 (38.2%) 38 (52.8%) 17 (23.6%)
Pubescent 25 (17.4%) 2 (2.8%) 23 (31.9%)
Postpubescent 64 (44.4%) 32 (44.4%) 32 (44.5%)
* <0.05; ** <0.01; *** <0.001; † WHO 2007
Table 2. Biases and 95% limits of agreement between predicted and measured BF%
Bias (%) 95% Limits of Agreement (%)
r
 Mean 95% CI Lower Upper
Goran 8.90 7.90 - 10.00 -3.80 21.70 0.44*
Slaughter
 (Tri+Calf)
6.02 4.60 - 7.45 -10.90 23.00 -0.31*
Slaughter
(Tri+SS) Whites
5.95 4.50 - 7.40 -11.70 23.60 -0.28*
Slaughter
(Tri+SS) Blacks
6.46 4.96 - 7.97 -11.43 24.35 -0.31*
* p<0.001; Bias: BF% by DXA minuses values from SFT equations; 95% limits of agreement: ± 2 SD of the mean difference
between two methods; r: correlation between bias and average of BF% form two methods. Abbreviation: CI: Confidence Interval;
Tri+Calf: Triceps and Medial Calf; Tri+SS: Triceps and Subscapular.
The first finding is the underestimation of BF% by predicted
equations. This could be explained by the differences in
anthropometric and ethnic characteristics. Firstly, Goran used a
Caucasian sample to develop his equations; Slaughter’s sample
also included Caucasian and Black children [14, 15]. A study by
Deurenberg et al [20] showed that Asian people might have 3–
5% higher body fat compared with Caucasian people with similar
BMIs. This can be because Asian people accumulate a greater
amount of abdominal fat tissue [21]. Secondly, roughly one in
two children in our sample were overweight or obese, while
Goran’s and Slaughter’s development samples were of the
normal weight range. Hence, bias and LOAs would become
wider. In other studies [22-25], the underestimation was also
reported and mean biases ranged from 2.9 to 11.1%. Only
14 MedPharmRes, 2020, Vol. 4, No. 2 Kim et al.
Wickramasinghe et al [26] showed that Slaughter equations for
white children overestimated by 5.9% ± 8.4 (mean bias ±
standard deviation).
The wide LOAs and significant change of bias across the
body fat continuum also described in previous studies [22-26].
These studies shared the same bias trends by Slaughter’s [22-26]
and Goran’s [24, 25]. The correlation was negative between BF%
bias from Slaughter equation and average BF% in children with
excessive fat in Gonzalez-Ruiz’s study and type 1 diabetes
children in Sarnblad’s study [22, 23]. However, in the healthy
group in Samblad’s study and Wickramasinghe et al, no
significant correlation was observed [23, 26].
Furthermore, the figure that 52.8% of the children were
overweight or obese might imply the growing trend of
overweight and obesity in urban area. In 2014, Thuy et al [27]
found that the prevalence in urban secondary schools in Hanoi
was 36.2%. Earlier in 2010, the figure in Phuong et al [28] were
27.5% of children from urban secondary schools in Ho Chi Minh
city.
The strength of our study is that we used DXA as a reference
method. This technique has high validity and reliability in
measuring BF% [13]. Furthermore, the use of Bland-Altman
analysis was more accurate than merely using correlation or t-test
to evaluate the agreement between two methods. However, we
find it hard to generalize our results because our sample was well-
characterised. Five conveniently-sampled schools were adjacent
to each other and located near the city centre. Also, our sample
was relatively small and could not be representative of children
of Ho Chi Minh city.
SFT equations are convenient tools to measure body
composition on the field. Therefore, more and more research has
been done to validate predictive equations on a specific
population. Our results raise a need to develop new
anthropometric equations on Vietnamese children. Also, larger-
scaled studies are warranted to determine the nutrition status of
children in urban and in rural schools as well.
5. CONCLUSION
Figure 1. Comparison of BF% measured by DXA in comparison with Goran and three Slaughter equations,
displayed as Bland-Altman plots.
Y-axis represents bias of BF% measured by DXA minus BF% measured by the equations. X-axis represents
average of BF% measured by DXA and the equations. Central dash lines represent the mean biases between 2
methods. Dotted lines on the either sides represent upper and lower limits of agreement. Solid diagonal lines are
fitted line representing the relationship between biases and average BF% by each pair of methods. Abbreviations:
Tri+Calf: Triceps and Medial Calf; Tri+SS: Triceps and Subscapular; BF%: body fat percentage; DXA: dual
energy X-ray absorptiometry; r: correlation between bias and average of BF% form two methods.
Validation of equations for estimating body fat in Vietnamese children MedPharmRes, 2020, Vol. 4, No. 2 15
We found that Slaughter and Goran equations cannot predict
accurately BF% of children in Ho Chi Minh city and the
development of new anthropometric equations is warranted.
Moreover, with the preliminary results showing an alarming
figure of over 50% of children with overweight or obese, we need
a large-scale study to have a bigger view of the situation.
ACKNOWLEDGEMENTS
General: We would like to send our gratefulness to
Chamber of Education, People Committee District 10;
Administration Committee of Thien Ho Duong Primary
School, Le Thi Rieng Primary School, Tran Phu Junior High
School, Hoang Van Thu Junior High School, Nguyen Du High
School for your cooperation and assistance throughout the
study.
Funding: This study was supported by Research Fund
provided by Pham Ngoc Thach University of Medicine.
Author Contributions: TK substantially contributes to
conceptual design, acquisition of data, drafting the article; TD
contributes to acquisition of data, data analysis and
interpretation, and revising the article; TT contributes to data
acquisition and data analysis; XN contributes to design the
study, critically revises the article; HT substantially
contributes to study design, critically revises the article,
makes final approval for submission.
Competing interests: The authors declare no conflict of
interest.
REFERENCES
1. New England Journal of Medicine. Health Effects of Overweight and
Obesity in 195 Countries over 25 Years. 2017;377(1):13-27.
2. Cao HTT. Phòng chống Thừa cân - Béo phì ở trẻ nhỏ: National Institute
of Nutrition. 2018.
3. Ward ZJ, Long MW, Resch SC, Giles CM, Cradock AL, Gortmaker SL.
Simulation of Growth Trajectories of Childhood Obesity into Adulthood.
New England Journal of Medicine. 2017;377(22):2145-53.
4. Singh AS, Mulder C, Twisk JW, Van Mechelen W, Chinapaw MJ.
Tracking of childhood overweight into adulthood: a systematic review of
the literature. Obesity Reviews. 2008;9(5):474-88.
5. Biro FM, Wien M. Childhood obesity and adult morbidities–. The
American journal of clinical nutrition. 2010;91(5):1499S-505S.
6. Halfon N, Larson K, Slusser W. Associations between obesity and
comorbid mental health, developmental, and physical health conditions
in a nationally representative sample of US children aged 10 to 17.
Academic pediatrics. 2013;13(1):6-13.
7. Park MH, Falconer C, Viner Ra, Kinra S. The impact of childhood
obesity on morbidity and mortality in adulthood: a systematic review.
Obesity reviews. 2012;13(11):985-1000.
8. Javed A, Jumean M, Murad MH, Okorodudu D, Kumar S, Somers VK,
et al. Diagnostic performance of body mass index to identify obesity as
defined by body adiposity in children and adolescents: a systematic
review and meta-analysis. Pediatric Obesity. 2015;10(3):234-44.
9. Romero-Corral A, Somers VK, Sierra-Johnson J, Thomas RJ, Collazo-
Clavell M, Korinek J, et al. Accuracy of body mass index in diagnosing
obesity in the adult general population. International journal of obesity.
2008;32(6):959.
10. Le TT, Chu DT, Hanh NTH. Percentage Body Fat is As a Good Indicator
for Determining Adolescents Who Are Overweight or Obese: A Cross-
Sectional Study in Vietnam. Osong public health and research
perspectives. 2019;10(2):108.
11. De-Lorenzo A, Bianchi A, Maroni P, Iannarelli A, Di Daniele N,
Iacopino L, et al. Adiposity rather than BMI determines metabolic risk.
International journal of cardiology. 2013;166(1):111-7.
12. Ellis KJ, Abrams SA, Wong WW. Monitoring childhood obesity:
assessment of the weight/height2 index. American Journal of
Epidemiology. 1999;150(9):939-46.
13. Hu FB. Measurements of adiposity and body composition. Obesity
epidemiology. 2008;416:53-83.
14. Slaughter MH, Lohman T, Boileau R, Horswill C, Stillman R, Van Loan
M, et al. Skinfold equations for estimation of body fatness in children
and youth. Human biology. 1988:709-23.
15. Goran MI, Driscoll P, Johnson R, Nagy TR, Hunter G. Cross-calibration
of body-composition techniques against dual-energy X-ray
absorptiometry in young children. The American journal of clinical
nutrition. 1996;63(3):299-305.
16. Lohman TG, Roche AF, Martorell R. Anthropometric standardization
reference manual: Human kinetics books Champaign; 1988.
17. Onis MD, Onyango AW, Borghi E, Siyam A, Nishida C, Siekmann J.
Development of a WHO growth reference for school-aged children and
adolescents. Bulletin of the World health Organization. 2007;85:660-7.
18. World Health Organization. Physical status: The use of and interpretation
of anthropometry, Report of a WHO Expert Committee. 1995.
19. Deurenberg P, Deurenberg-Yap M, Guricci S. Asians are different from
Caucasians and from each other in their body mass index/body fat per
cent relationship. Obesity reviews : an official journal of the International
Association for the Study of Obesity. 2002;3(3):141-6.
20. Lear SA, Humphries KH, Kohli S, Chockalingam A, Frohlich JJ,
Birmingham CL. Visceral adipose tissue accumulation differs according
to ethnic background: results of the Multicultural Community Health
Assessment Trial (M-CHAT). Am J Clin Nutr. 2007;86(2):353-9.
21. González-Ruíz K, Medrano M, Correa-Bautista J, García-Hermoso A,
Prieto-Benavides D, Tordecilla-Sanders A, et al. Comparison of
bioelectrical impedance analysis, slaughter skinfold-thickness equations,
and dual-energy x-ray absorptiometry for estimating body fat percentage
in colombian children and adolescents with excess of adiposity.
Nutrients. 2018;10(8):1086.
22. Särnblad S, Magnuson A, Ekelund U, Åman J. Body fat measurement in
adolescent girls with type 1 diabetes: a comparison of skinfold equations
against dual‐energy X‐ray absorptiometry. Acta Paediatrica.
2016;105(10):1211-5.
23. Noradilah MJ, Ang YN, Kamaruddin NA, Deurenberg P, Ismail MN,
Poh BK. Assessing body fat of children by skinfold thickness,
bioelectrical impedance analysis, and dual-energy x-ray absorptiometry:
A validation study among Malay children aged 7 to 11 years. Asia Pacific
Journal of Public Health. 2016;28(5_suppl):74S-84S.
24. Hussain Z, Jafar T, uz Zaman M, Parveen R, Saeed F. Correlations of
skin fold thickness and validation of prediction equations using DEXA
as the gold standard for estimation of body fat composition in Pakistani
children. BMJ open. 2014;4(4):e004194.
25. Wickramasinghe VP, Lamabadusuriay SP, Cleghorn GJ, Davies PS. Use
of skin-fold thickness in Sri Lankan children: comparison of several
prediction equations. The Indian Journal of Pediatrics.
2008;75(12):1237-42.
26. Pham TTP, Matsushita Y, Dinh LTK, Do TV, Nguyen TTT, Bui AT, et
al. Prevalence and associated factors of overweight and obesity among
schoolchildren in Hanoi, Vietnam. BMC public health.
2019;19(1):1478-.
27. Nguyen PVN, Hong TK, Hoang T, Robert AR. High prevalence of
overweight among adolescents in Ho Chi Minh City, Vietnam. BMC
Public Health. 2013;13(1):141.
File đính kèm:
 validation_of_predictive_equations_against_dxa_for_estimatio.pdf

