Linearizing the growth standard table of children aging 36 to 120 months
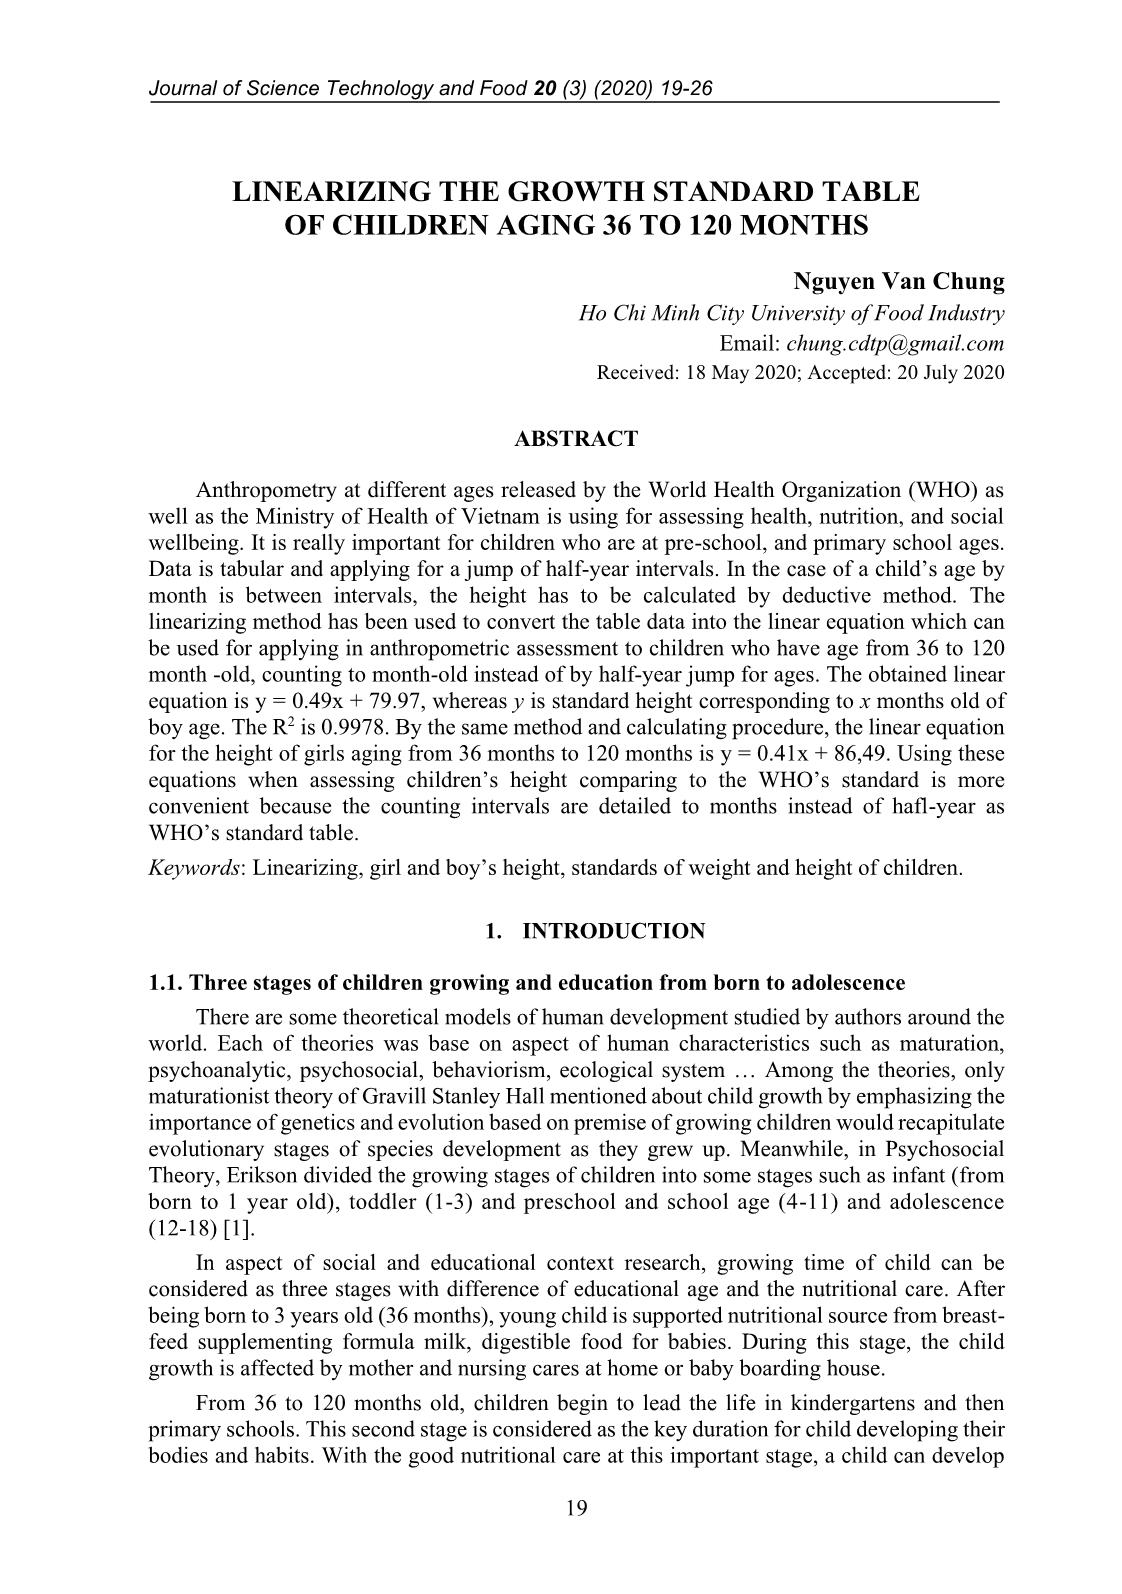
Anthropometry at different ages released by the World Health Organization (WHO) as
well as the Ministry of Health of Vietnam is using for assessing health, nutrition, and social
wellbeing. It is really important for children who are at pre-school, and primary school ages.
Data is tabular and applying for a jump of half-year intervals. In the case of a child’s age by
month is between intervals, the height has to be calculated by deductive method. The
linearizing method has been used to convert the table data into the linear equation which can
be used for applying in anthropometric assessment to children who have age from 36 to 120
month -old, counting to month-old instead of by half-year jump for ages. The obtained linear
equation is y = 0.49x + 79.97, whereas y is standard height corresponding to x months old of
boy age. The R2 is 0.9978. By the same method and calculating procedure, the linear equation
for the height of girls aging from 36 months to 120 months is y = 0.41x + 86,49. Using these
equations when assessing children’s height comparing to the WHO’s standard is more
convenient because the counting intervals are detailed to months instead of hafl-year as
WHO’s standard table.
Trang 1
Trang 2
Trang 3
Trang 4
Trang 5
Trang 6
Trang 7
Trang 8
Tóm tắt nội dung tài liệu: Linearizing the growth standard table of children aging 36 to 120 months
Journal of Science Technology and Food 20 (3) (2020) 19-26
19
LINEARIZING THE GROWTH STANDARD TABLE
OF CHILDREN AGING 36 TO 120 MONTHS
Nguyen Van Chung
Ho Chi Minh City University of Food Industry
Email: chung.cdtp@gmail.com
Received: 18 May 2020; Accepted: 20 July 2020
ABSTRACT
Anthropometry at different ages released by the World Health Organization (WHO) as
well as the Ministry of Health of Vietnam is using for assessing health, nutrition, and social
wellbeing. It is really important for children who are at pre-school, and primary school ages.
Data is tabular and applying for a jump of half-year intervals. In the case of a child’s age by
month is between intervals, the height has to be calculated by deductive method. The
linearizing method has been used to convert the table data into the linear equation which can
be used for applying in anthropometric assessment to children who have age from 36 to 120
month -old, counting to month-old instead of by half-year jump for ages. The obtained linear
equation is y = 0.49x + 79.97, whereas y is standard height corresponding to x months old of
boy age. The R2 is 0.9978. By the same method and calculating procedure, the linear equation
for the height of girls aging from 36 months to 120 months is y = 0.41x + 86,49. Using these
equations when assessing children’s height comparing to the WHO’s standard is more
convenient because the counting intervals are detailed to months instead of hafl-year as
WHO’s standard table.
Keywords: Linearizing, girl and boy’s height, standards of weight and height of children.
1. INTRODUCTION
1.1. Three stages of children growing and education from born to adolescence
There are some theoretical models of human development studied by authors around the
world. Each of theories was base on aspect of human characteristics such as maturation,
psychoanalytic, psychosocial, behaviorism, ecological system  Among the theories, only
maturationist theory of Gravill Stanley Hall mentioned about child growth by emphasizing the
importance of genetics and evolution based on premise of growing children would recapitulate
evolutionary stages of species development as they grew up. Meanwhile, in Psychosocial
Theory, Erikson divided the growing stages of children into some stages such as infant (from
born to 1 year old), toddler (1-3) and preschool and school age (4-11) and adolescence
(12-18) [1].
In aspect of social and educational context research, growing time of child can be
considered as three stages with difference of educational age and the nutritional care. After
being born to 3 years old (36 months), young child is supported nutritional source from breast-
feed supplementing formula milk, digestible food for babies. During this stage, the child
growth is affected by mother and nursing cares at home or baby boarding house.
From 36 to 120 months old, children begin to lead the life in kindergartens and then
primary schools. This second stage is considered as the key duration for child developing their
bodies and habits. With the good nutritional care at this important stage, a child can develop
Nguyen Van Chung
20
his or her body to meet the standards of height and body mass. Every deviation of nutritional
status could be corrected in this time before being adolescence and then adults.
In the third stage, from 10 to 18 years old, adolescent children are nearly stable state to
grow until to adult. Their bodies developing depend on the dietary and physical activities.
1.2. Child growth standards
As for anthropology, height (H) and mass (M) are the main factors to assess the growth
of children while combining in BMI formula calculation (Body Mass Index) [2].
BMI =
M
H2
 (kg/m2)
Whereas:
M: mass of body (kg);
H: the height (m).
According to WHO, one being considered as normal body has BMI between 18.5 to
22.99. It means the BMI lower than 18.5 is in malnutritional zone and respectively is
overweight for higher than 22.9.
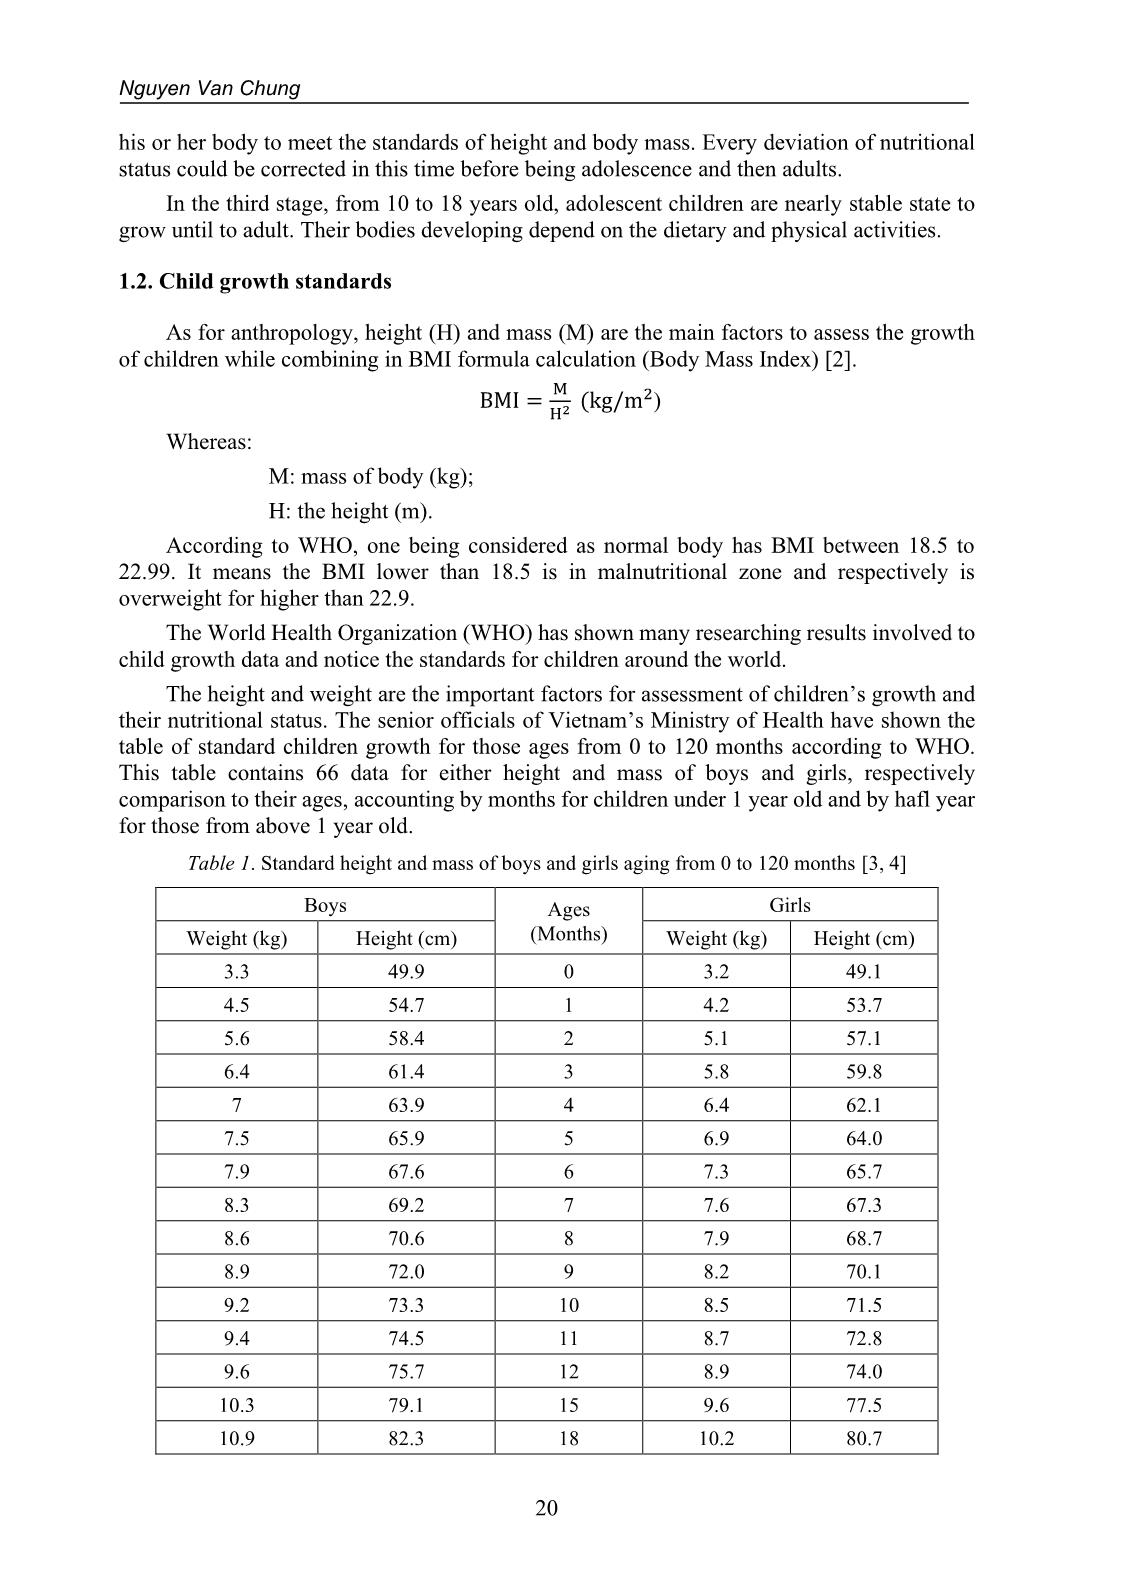
The World Health Organization (WHO) has shown many researching results involved to
child growth data and notice the standards for children around the world.
The height and weight are the important factors for assessment of children’s growth and
their nutritional status. The senior officials of Vietnam’s Ministry of Health have shown the
table of standard children growth for those ages from 0 to 120 months according to WHO.
This table contains 66 data for either height and mass of boys and girls, respectively
comparison to their ages, accounting by months for children under 1 year old and by hafl year
for those from above 1 year old.
Table 1. Standard height and mass of boys and girls aging from 0 to 120 months [3, 4]
Boys Ages
(Months)
Girls
Weight (kg) Height (cm) Weight (kg) Height (cm)
3.3 49.9 0 3.2 49.1
4.5 54.7 1 4.2 53.7
5.6 58.4 2 5.1 57.1
6.4 61.4 3 5.8 59.8
7 63.9 4 6.4 62.1
7.5 65.9 5 6.9 64.0
7.9 67.6 6 7.3 65.7
8.3 69.2 7 7.6 67.3
8.6 70.6 8 7.9 68.7
8.9 72.0 9 8.2 70.1
9.2 73.3 10 8.5 71.5
9.4 74.5 11 8.7 72.8
9.6 75.7 12 8.9 74.0
10.3 79.1 15 9.6 77.5
10.9 82.3 18 10.2 80.7
Linearizing the growth standard table of children aging 36 to 120 months
21
Boys Ages
(Months)
Girls
Weight (kg) Height (cm) Weight (kg) Height (cm)
11.5 85.1 21 10.9 83.7
12.2 87.1 24 11.5 86.4
13.3 91.9 30 12.7 90.7
14.3 96.1 36 13.9 95.1
15.3 99.9 42 15.0 99.0
16.3 103.3 48 16.1 102.7
17.3 106.7 54 17.2 106.2
18.3 110.0 60 18.2 109.4
19.4 112.9 66 19.1 112.2
20.5 116.0 72 20.2 115.1
21.7 118.9 78 21.2 118.0
22.9 121.7 84 22.4 120.8
24.1 124.5 90 23.6 123.7
25.4 127.3 96 25.0 126.6
26.7 129.9 102 26.6 129.5
28.1 132.6 108 28.2 132.5
29.6 135.2 114 30.0 135.5
32.0 137.8 120 31.9 138.6
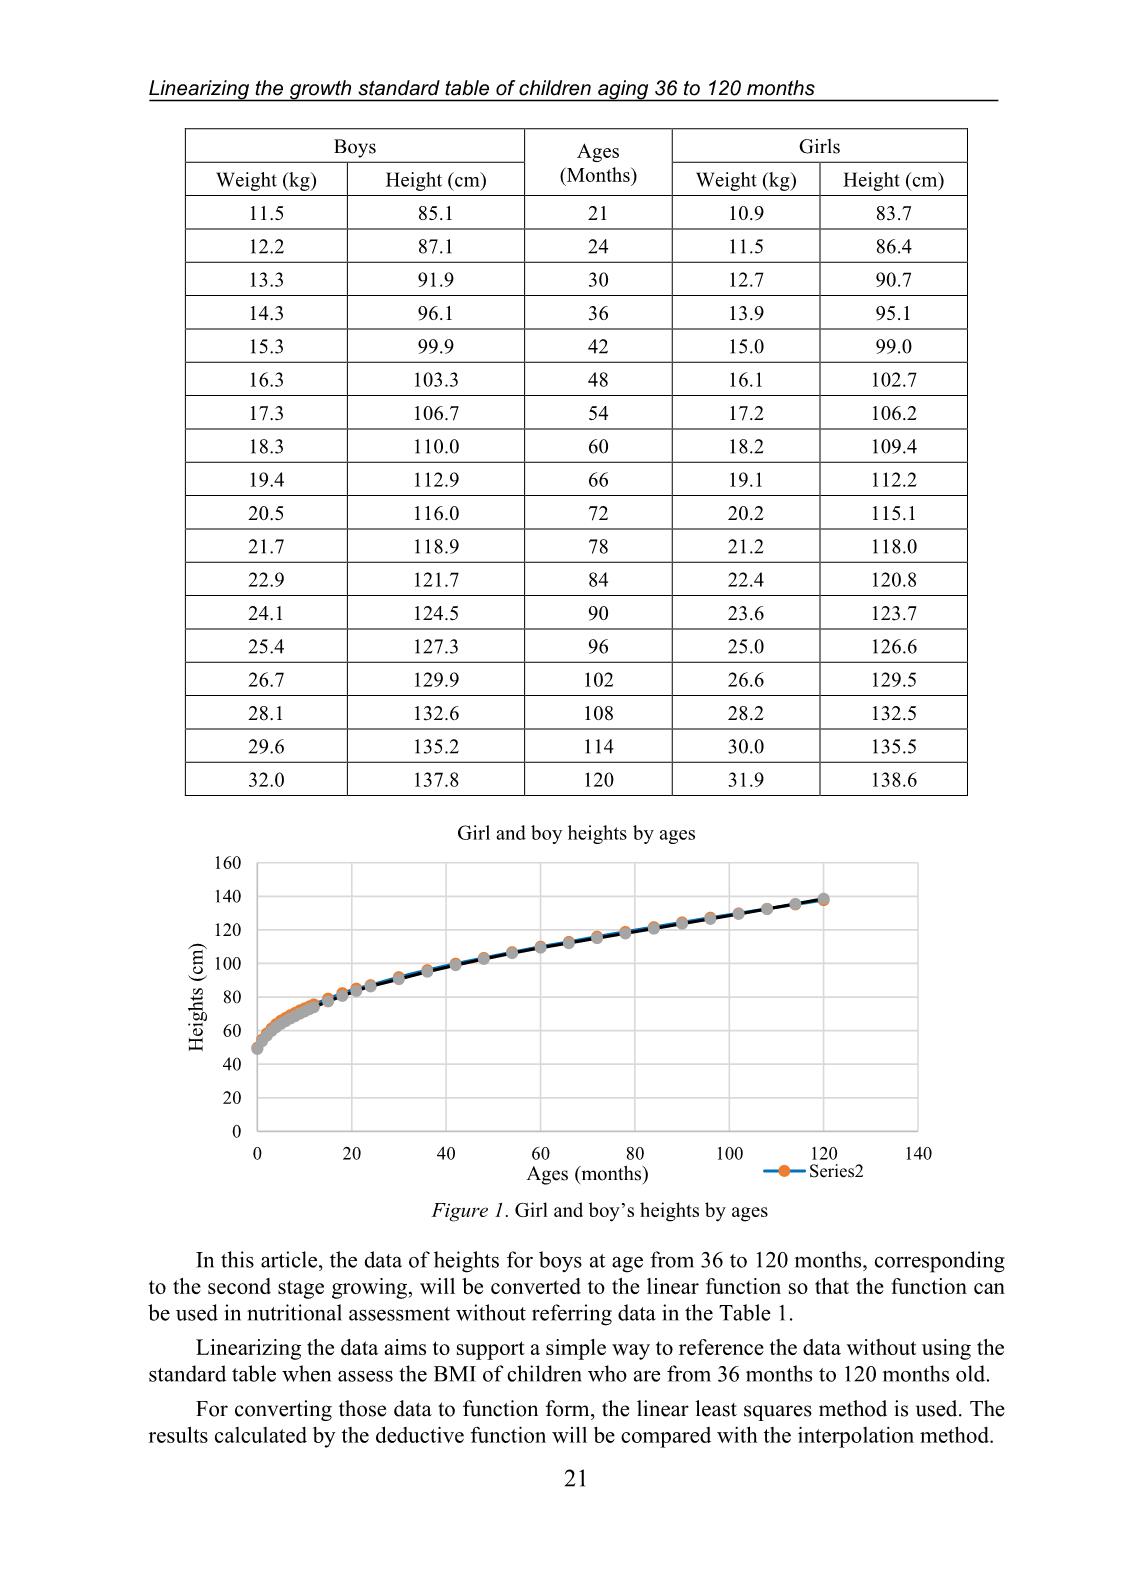
Figure 1. Girl and boy’s heights by ages
In this article, the data of heights for boys at age from 36 to 120 months, corresponding
to the second stage growing, will be converted to the linear function so that the function can
be used in nutritional assessment without referring data in the Table 1.
Linearizing the data aims to support a simple way to reference the data without using the
standard table when assess the BMI of children who are from 36 months to 120 months old.
For converting those data to function form, the linear least squares method is used. The
results calculated by the deductive function will be compared with the interpolation method.
0
20
40
60
80
100
120
140
160
0 20 40 60 80 100 120 140
H
ei
g
h
ts
 (
cm
)
Ages (months)
Girl and boy heights by ages
Series2
Nguyen Van Chung
22
2. METHOD AND DATABASE
The standard of child’s height and weight by age announced by WHO 2007 will be used
as the main data, using the boy’s height index of personal data who aged from 36 to 120 months
of age.
Using the least squares method to convert the data table to the linear equation.
3. RESULTS AND DISCUSSION
In the Figure 1, the data of height for both boys and girls by ages from 36 to 120 months
can be approximated in the straight line.
Function: y = ax + b
Whereas:
y: target function, as height factors.
x: variant of number of ages from 36 to 120 months
a and b: the constants
Therefore, the display function for those data could be linear after using least squares to
have the best results that nearest table data.
It is known that the set of scatter data can be displayed by the straight line using the
bellow simultaneous equations. The two constants a and b can be calculated out after analyzing
the set of equations.
{
𝑎 ∑ 𝑥𝑖
2 + 𝑏 ∑ 𝑥𝑖 = ∑ 𝑥𝑖𝑦𝑖 (1)
𝑛
𝑛=1
𝑛
𝑛=1
𝑛
𝑛=1
𝑎 ∑ 𝑥𝑖 + 𝑛𝑏 = ∑ 𝑦𝑖
𝑛
𝑛=1
𝑛
𝑛=1 (2)
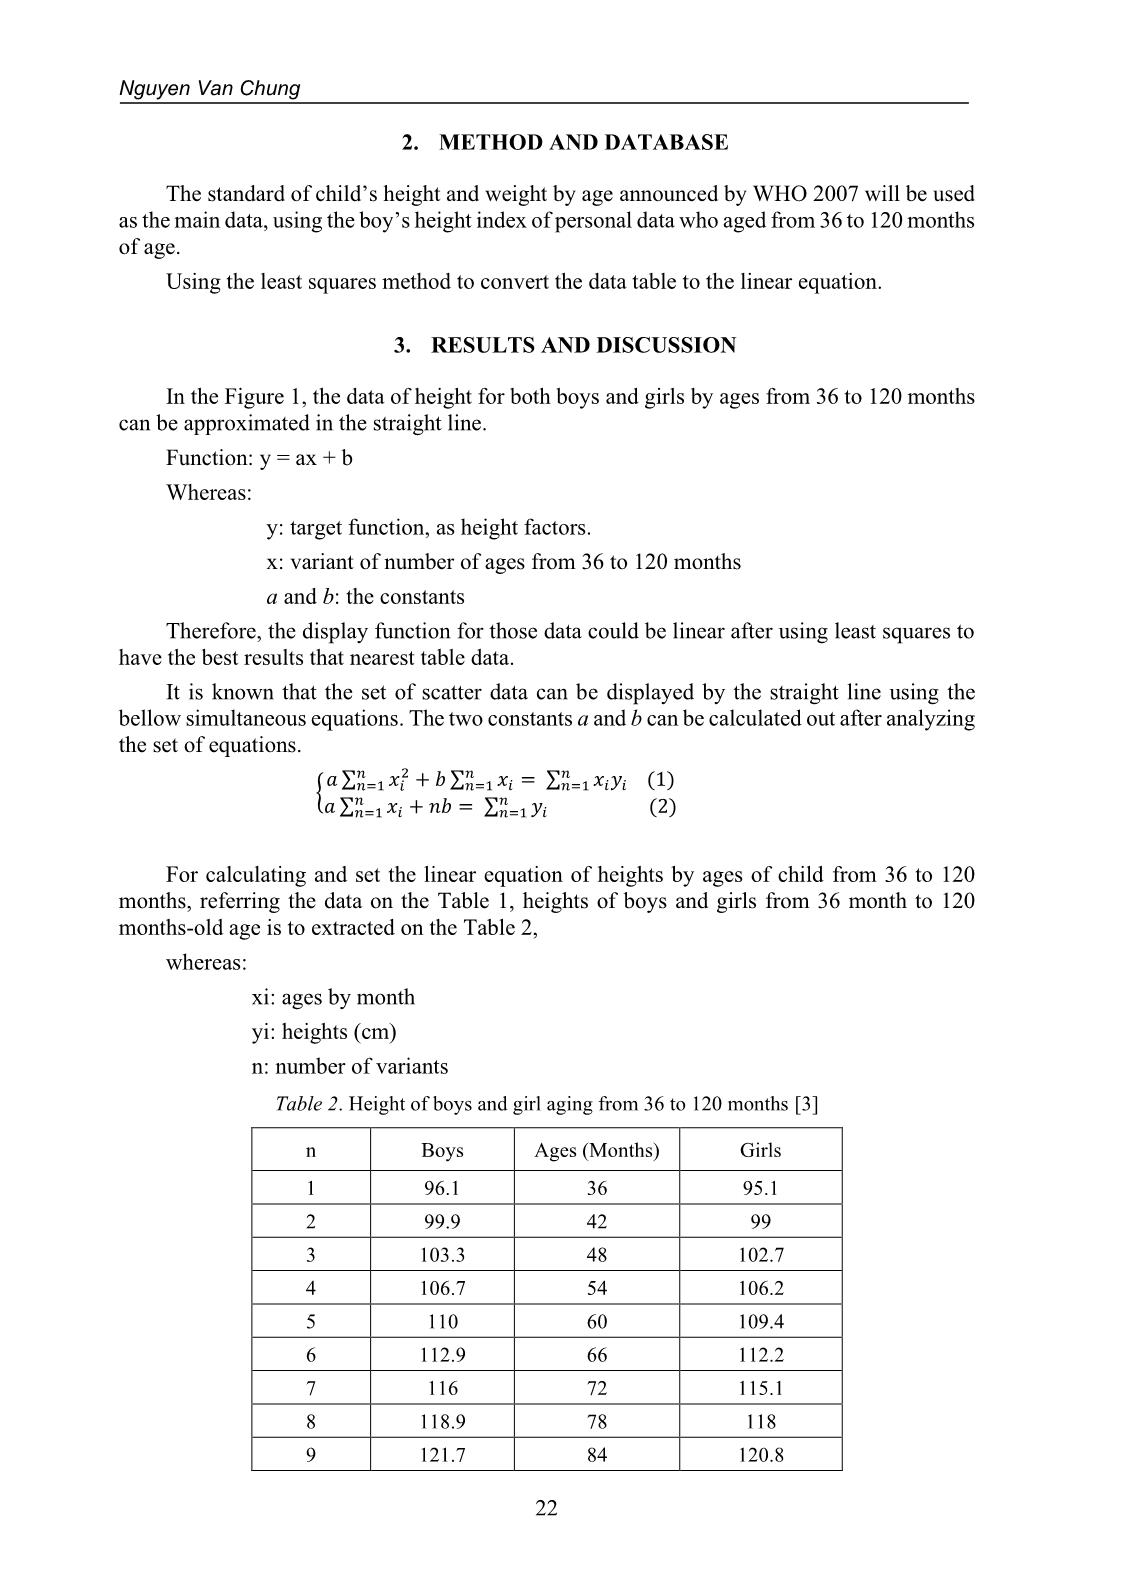
For calculating and set the linear equation of heights by ages of child from 36 to 120
months, referring the data on the Table 1, heights of boys and girls from 36 month to 120
months-old age is to extracted on the Table 2,
whereas:
xi: ages by month
yi: heights (cm)
n: number of variants
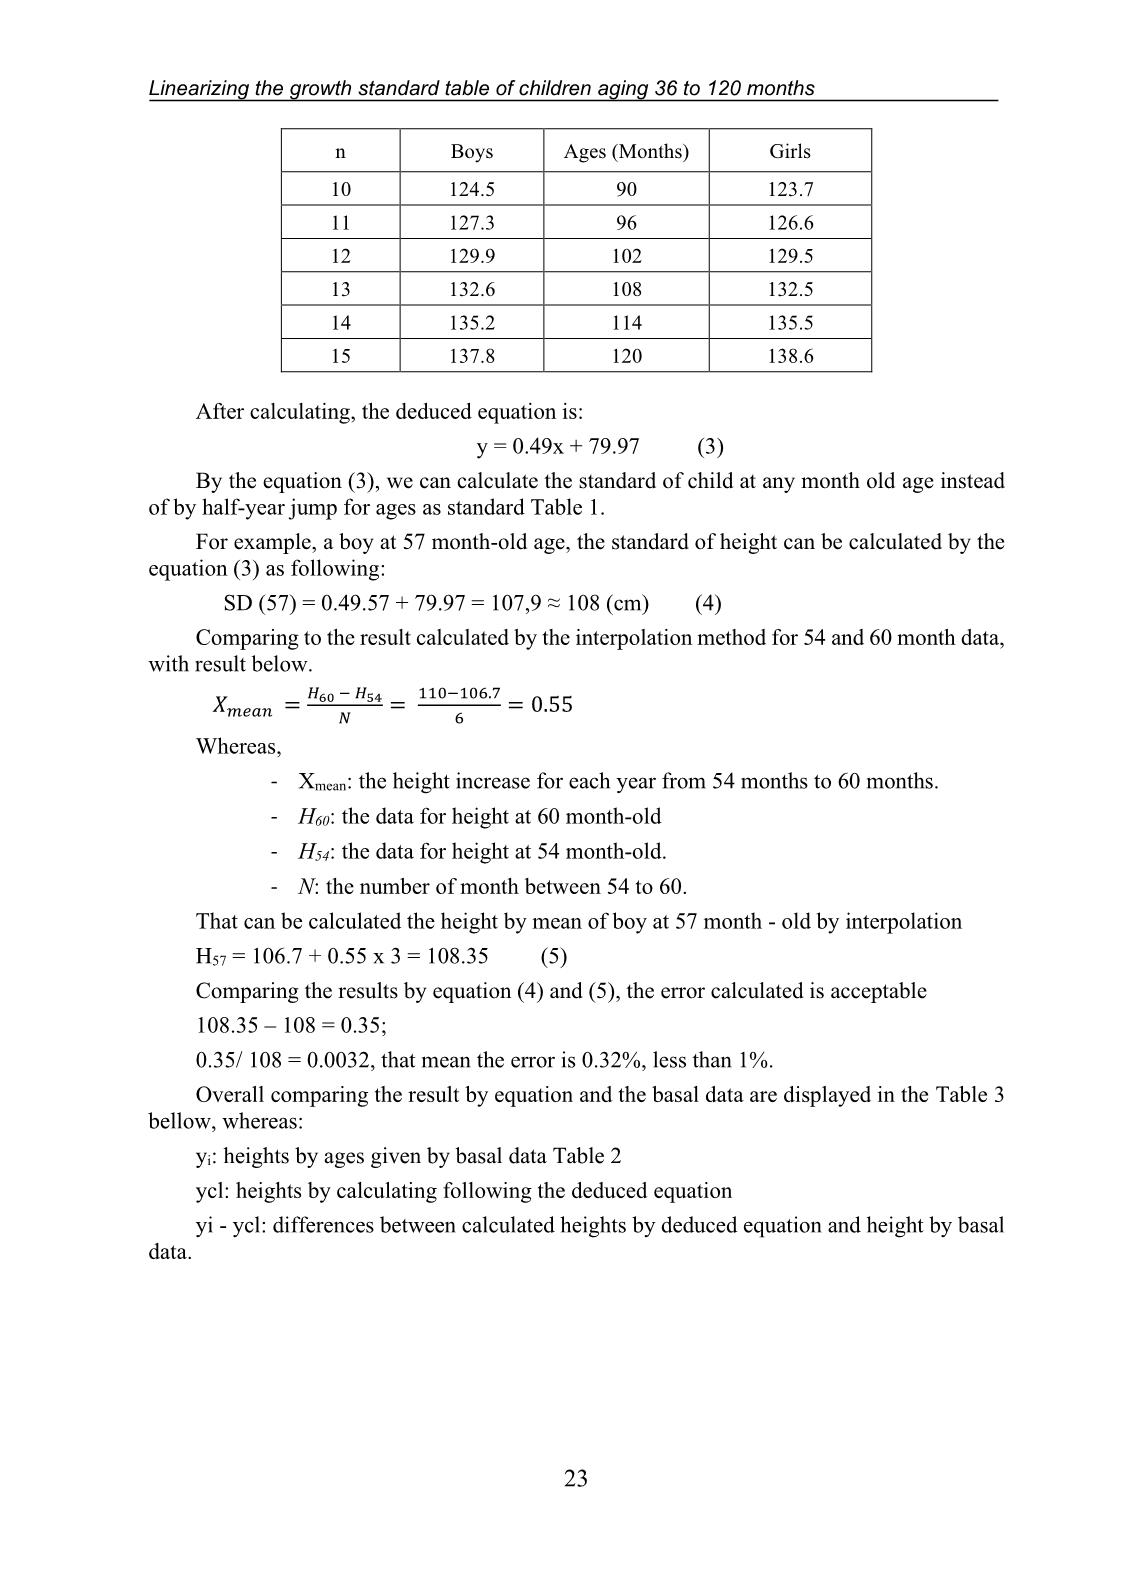
Table 2. Height of boys and girl aging from 36 to 120 months [3]
n Boys Ages (Months) Girls
1 96.1 36 95.1
2 99.9 42 99
3 103.3 48 102.7
4 106.7 54 106.2
5 110 60 109.4
6 112.9 66 112.2
7 116 72 115.1
8 118.9 78 118
9 121.7 84 120.8
Linearizing the growth standard table of children aging 36 to 120 months
23
n Boys Ages (Months) Girls
10 124.5 90 123.7
11 127.3 96 126.6
12 129.9 102 129.5
13 132.6 108 132.5
14 135.2 114 135.5
15 137.8 120 138.6
After calculating, the deduced equation is:
y = 0.49x + 79.97 (3)
By the equation (3), we can calculate the standard of child at any month old age instead
of by half-year jump for ages as standard Table 1.
For example, a boy at 57 month-old age, the standard of height can be calculated by the
equation (3) as following:
SD (57) = 0.49.57 + 79.97 = 107,9 ≈ 108 (cm) (4)
Comparing to the result calculated by the interpolation method for 54 and 60 month data,
with result below.
 𝑋𝑚𝑒𝑎𝑛 =
𝐻60 − 𝐻54
𝑁
=
110−106.7
6
= 0.55
Whereas,
- Xmean: the height increase for each year from 54 months to 60 months.
- H60: the data for height at 60 month-old
- H54: the data for height at 54 month-old.
- N: the number of month between 54 to 60.
That can be calculated the height by mean of boy at 57 month - old by interpolation
H57 = 106.7 + 0.55 x 3 = 108.35 (5)
Comparing the results by equation (4) and (5), the error calculated is acceptable
108.35 – 108 = 0.35;
0.35/ 108 = 0.0032, that mean the error is 0.32%, less than 1%.
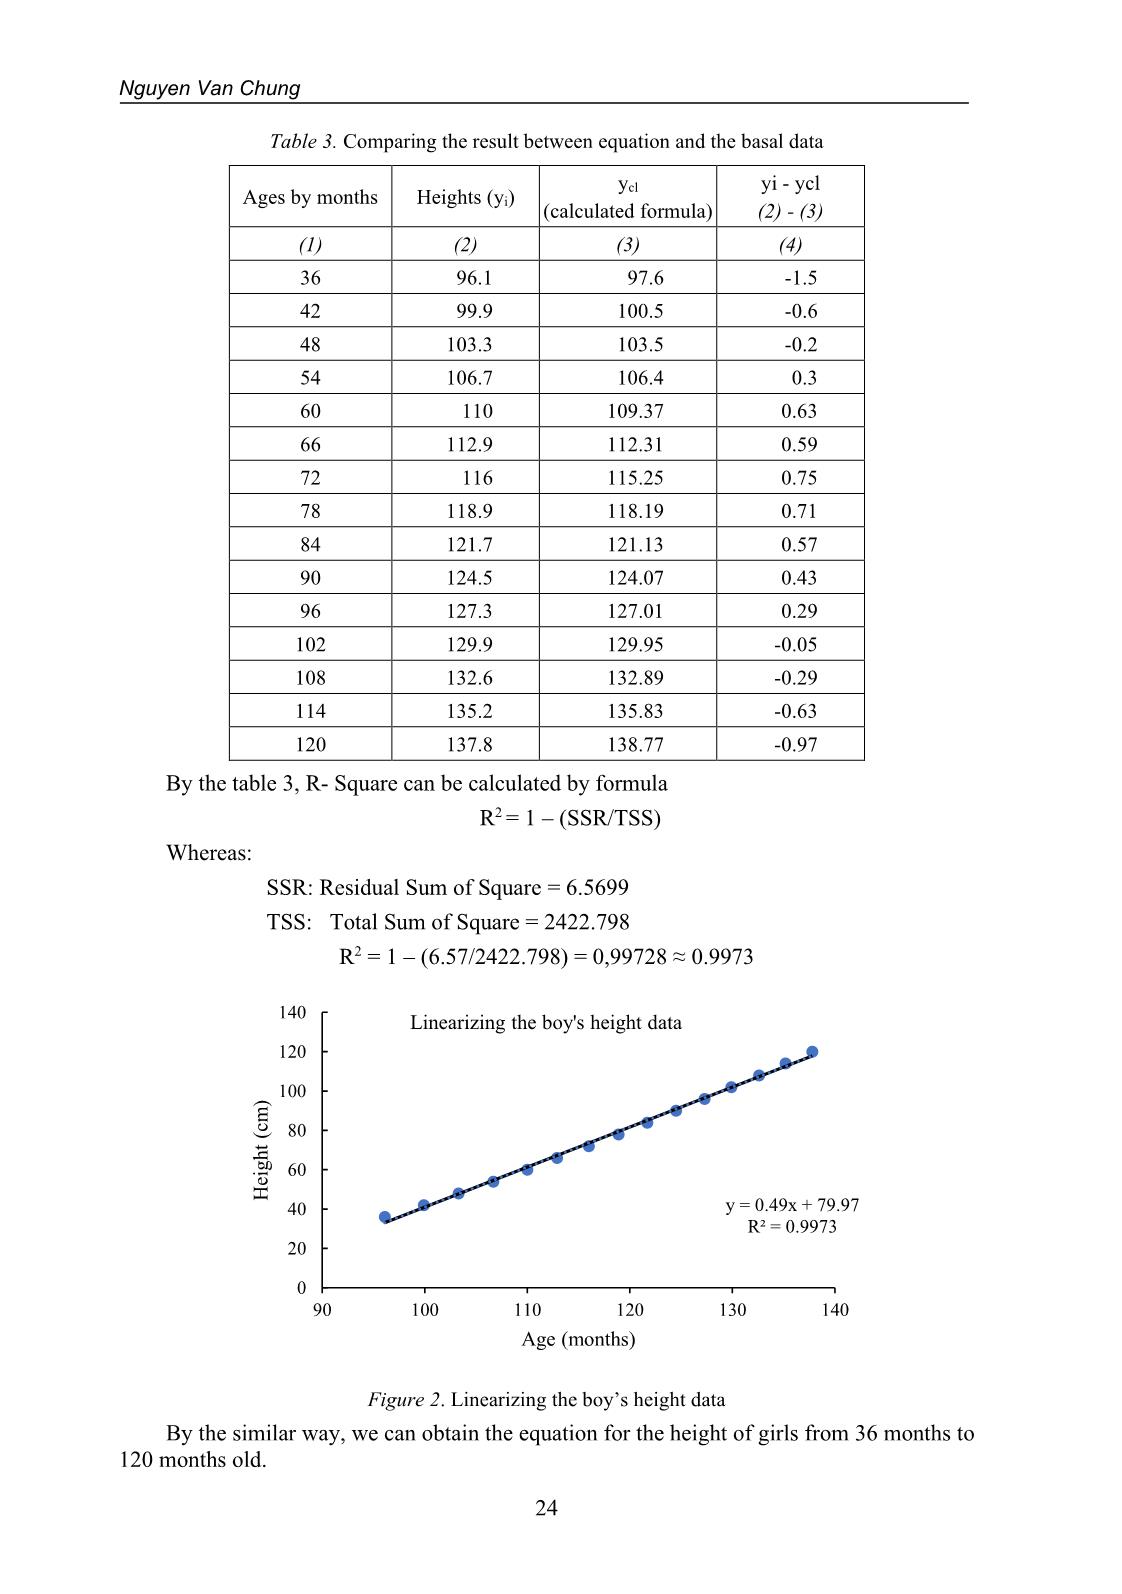
Overall comparing the result by equation and the basal data are displayed in the Table 3
bellow, whereas:
yi: heights by ages given by basal data Table 2
ycl: heights by calculating following the deduced equation
yi - ycl: differences between calculated heights by deduced equation and height by basal
data.
Nguyen Van Chung
24
Table 3. Comparing the result between equation and the basal data
Ages by months Heights (yi)
ycl
(calculated formula)
yi - ycl
(2) - (3)
(1) (2) (3) (4)
36 96.1 97.6 -1.5
42 99.9 100.5 -0.6
48 103.3 103.5 -0.2
54 106.7 106.4 0.3
60 110 109.37 0.63
66 112.9 112.31 0.59
72 116 115.25 0.75
78 118.9 118.19 0.71
84 121.7 121.13 0.57
90 124.5 124.07 0.43
96 127.3 127.01 0.29
102 129.9 129.95 -0.05
108 132.6 132.89 -0.29
114 135.2 135.83 -0.63
120 137.8 138.77 -0.97
By the table 3, R- Square can be calculated by formula
R2 = 1 – (SSR/TSS)
Whereas:
SSR: Residual Sum of Square = 6.5699
TSS: Total Sum of Square = 2422.798
R2 = 1 – (6.57/2422.798) = 0,99728 ≈ 0.9973
Figure 2. Linearizing the boy’s height data
By the similar way, we can obtain the equation for the height of girls from 36 months to
120 months old.
y = 0.49x + 79.97
R² = 0.9973
0
20
40
60
80
100
120
140
90 100 110 120 130 140
H
ei
g
h
t
(c
m
)
Age (months)
Linearizing the boy's height data
Linearizing the growth standard table of children aging 36 to 120 months
25
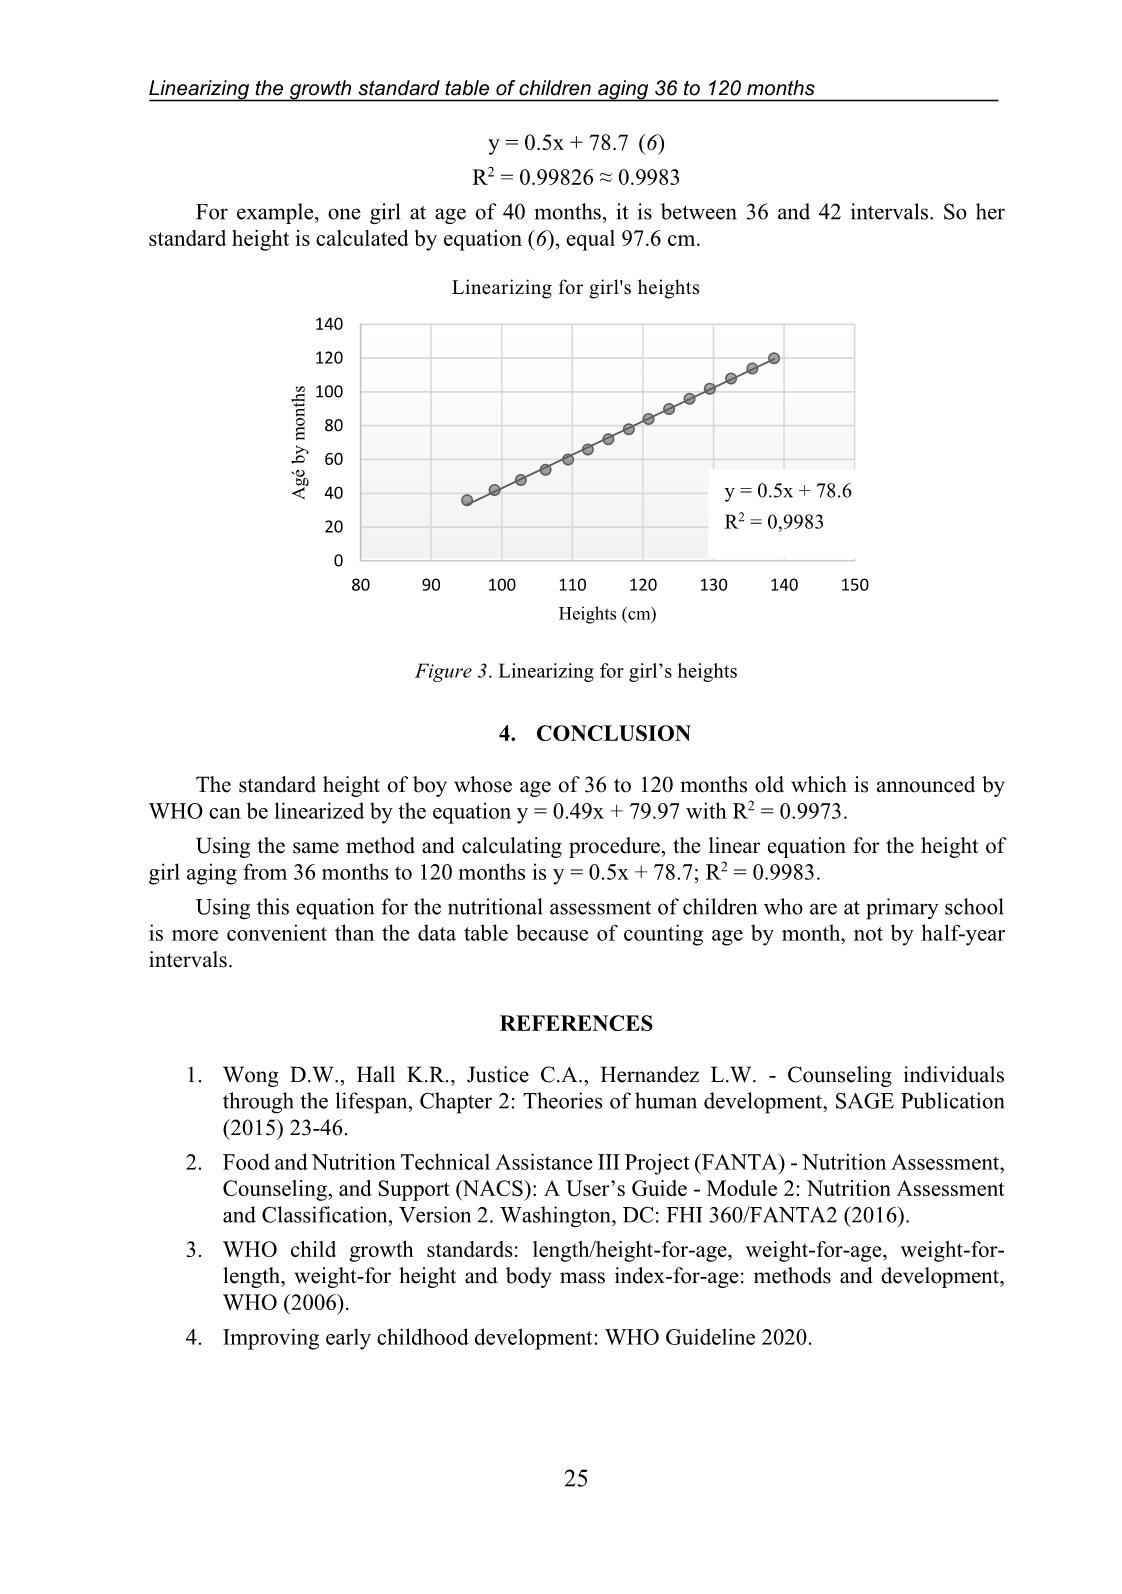
y = 0.5x + 78.7 (6)
R2 = 0.99826 ≈ 0.9983
For example, one girl at age of 40 months, it is between 36 and 42 intervals. So her
standard height is calculated by equation (6), equal 97.6 cm.
Figure 3. Linearizing for girl’s heights
4. CONCLUSION
The standard height of boy whose age of 36 to 120 months old which is announced by
WHO can be linearized by the equation y = 0.49x + 79.97 with R2 = 0.9973.
Using the same method and calculating procedure, the linear equation for the height of
girl aging from 36 months to 120 months is y = 0.5x + 78.7; R2 = 0.9983.
Using this equation for the nutritional assessment of children who are at primary school
is more convenient than the data table because of counting age by month, not by half-year
intervals.
REFERENCES
1. Wong D.W., Hall K.R., Justice C.A., Hernandez L.W. - Counseling individuals
through the lifespan, Chapter 2: Theories of human development, SAGE Publication
(2015) 23-46.
2. Food and Nutrition Technical Assistance III Project (FANTA) - Nutrition Assessment,
Counseling, and Support (NACS): A User’s Guide - Module 2: Nutrition Assessment
and Classification, Version 2. Washington, DC: FHI 360/FANTA2 (2016).
3. WHO child growth standards: length/height-for-age, weight-for-age, weight-for-
length, weight-for height and body mass index-for-age: methods and development,
WHO (2006).
4. Improving early childhood development: WHO Guideline 2020.
0
20
40
60
80
100
120
140
80 90 100 110 120 130 140 150
A
g
é
b
y
 m
o
n
th
s
Heights (cm)
Linearizing for girl's heights
y = 0.5x + 78.6
R2 = 0,9983
Nguyen Van Chung
26
TÓM TẮT
TUYẾN TÍNH HÓA BẢNG CHIỀU CAO CỦA TRẺ TỪ 36 ĐẾN 120 THÁNG TUỔI
Nguyễn Văn Chung
Trường Đại học Công nghiệp Thực phẩm TP.HCM
Email: chung.cdtp@gmail.com
Tiêu chuẩn chiều cao của trẻ em được Tổ chức Y tế thế giới (WHO) và Bộ Y tế Việt Nam
công bố được sử dụng làm cơ sở đánh giá dinh dưỡng cho trẻ, nó đặc biệt quan trọng với trẻ ở
lứa tuổi đang học mẫu giáo và tiểu học. Các số liệu được trình bày ở dạng bảng và tính cho
tuổi tròn theo bước nửa năm. Trong trường hợp trẻ có số tháng tuổi ở khoảng giữa nửa năm
theo mốc số liệu của WHO sẽ phải dùng phép nội suy. Bài báo này công bố kết quả chuyển
đổi số liệu bảng thành phương trình tuyến tính áp dụng cho đánh giá nhân trắc cho bé trai từ
36 đến 120 tháng tuổi, tính theo tháng thay vì theo bước nhảy nửa năm bằng phương trình
tuyến tính y = 0,49x + 79,97; trong đó, y là tiêu chuẩn chiều cao tương ứng với x là số tháng
tuổi, hệ số R2 là 0,9978. Với cách tính tương tự, phương trình tuyến tính cho số liệu chiều cao
chuẩn của bé gái từ 36 đến 12 tháng tuổi là y = 0,5x + 78,7. Sử dụng các phương trình tính
toán được sẽ thuận lợi hơn cho việc đối chiếu chiều cao của trẻ từ 36 đến 120 tháng tuổi với
tiêu chuẩn của WHO bởi có thể đối chiếu chi tiết đến từng tháng tuổi thay vì bước nhảy nửa
năm như bảng số liệu của WHO.
Từ khóa: Tuyến tính hóa, chiều cao của bé trai và bé gái, tiêu chuẩn về chiều cao và cân nặng
của trẻ.
File đính kèm:
 linearizing_the_growth_standard_table_of_children_aging_36_t.pdf

