Application of remote sensing imagery and algorithms in Google earth engine platform for drought assessment
In Vietnam, drought is one of the natural disasters caused by high
temperatures and lack of precipitation, especially with El Nino and the
global warming phenomenon. It affects directly environmental,
economical, social issues, and the lives of humans. Many methods have
been used to assess drought, in which remote sensing indices are
considered the most commonly used tool today. They are used to analyze
spatio-temporal distribution of drought conditions and identify drought
severity. Especially with the launch of Google Earth Engine (GEE) - a
cloud-based platform for geospatial analysis, it is easy to access highperformance computing resources for processing multi-temporal satellite
data online. With the GEE platform, we focus on writing and running
scripts with the indicators suitable for evaluating drought phenomenon,
instead of calculating on software and downloading remote sensing
imagery with large size. In this study, we collected 26 Landsat 8 images in
the dry season in 2019 (from April to July) in Tay Hoa district, Phu Yen –
a region in the South Central Coast of Vietnam where agricultural
drought occurs frequently. We assessed the distribution of drought
conditions by using a drought index (VHI index – Vegetation Health Index)
produced from Landsat satellite data in the GEE platform. The study
results indicated that the drought (from mild to severe) concentrated in
the North of the region, corresponding to high surface temperature and
NDVI low or NDVI moderate values. VHI maps were visually compared
with the drought map of the South Central Coast and the Central
Highlands. In general, the results also reflect the the method’s reliability
and can be used to support the managers to plan policies, making longterm plans to cope with climate change in the future at Tay Hoa in
particular and other regions in general.
Trang 1
Trang 2
Trang 3
Trang 4
Trang 5
Trang 6
Trang 7
Trang 8
Trang 9
Trang 10
Tải về để xem bản đầy đủ
Tóm tắt nội dung tài liệu: Application of remote sensing imagery and algorithms in Google earth engine platform for drought assessment
 Journal of Mining and Earth Sciences Vol. 62, Issue 3 (2020) 53 - 67 53
Application of Remote Sensing Imagery and
Algorithms in Google Earth Engine platform for
Drought Assessment
Hoa Thanh Thi Pham *, Ha Thanh Tran
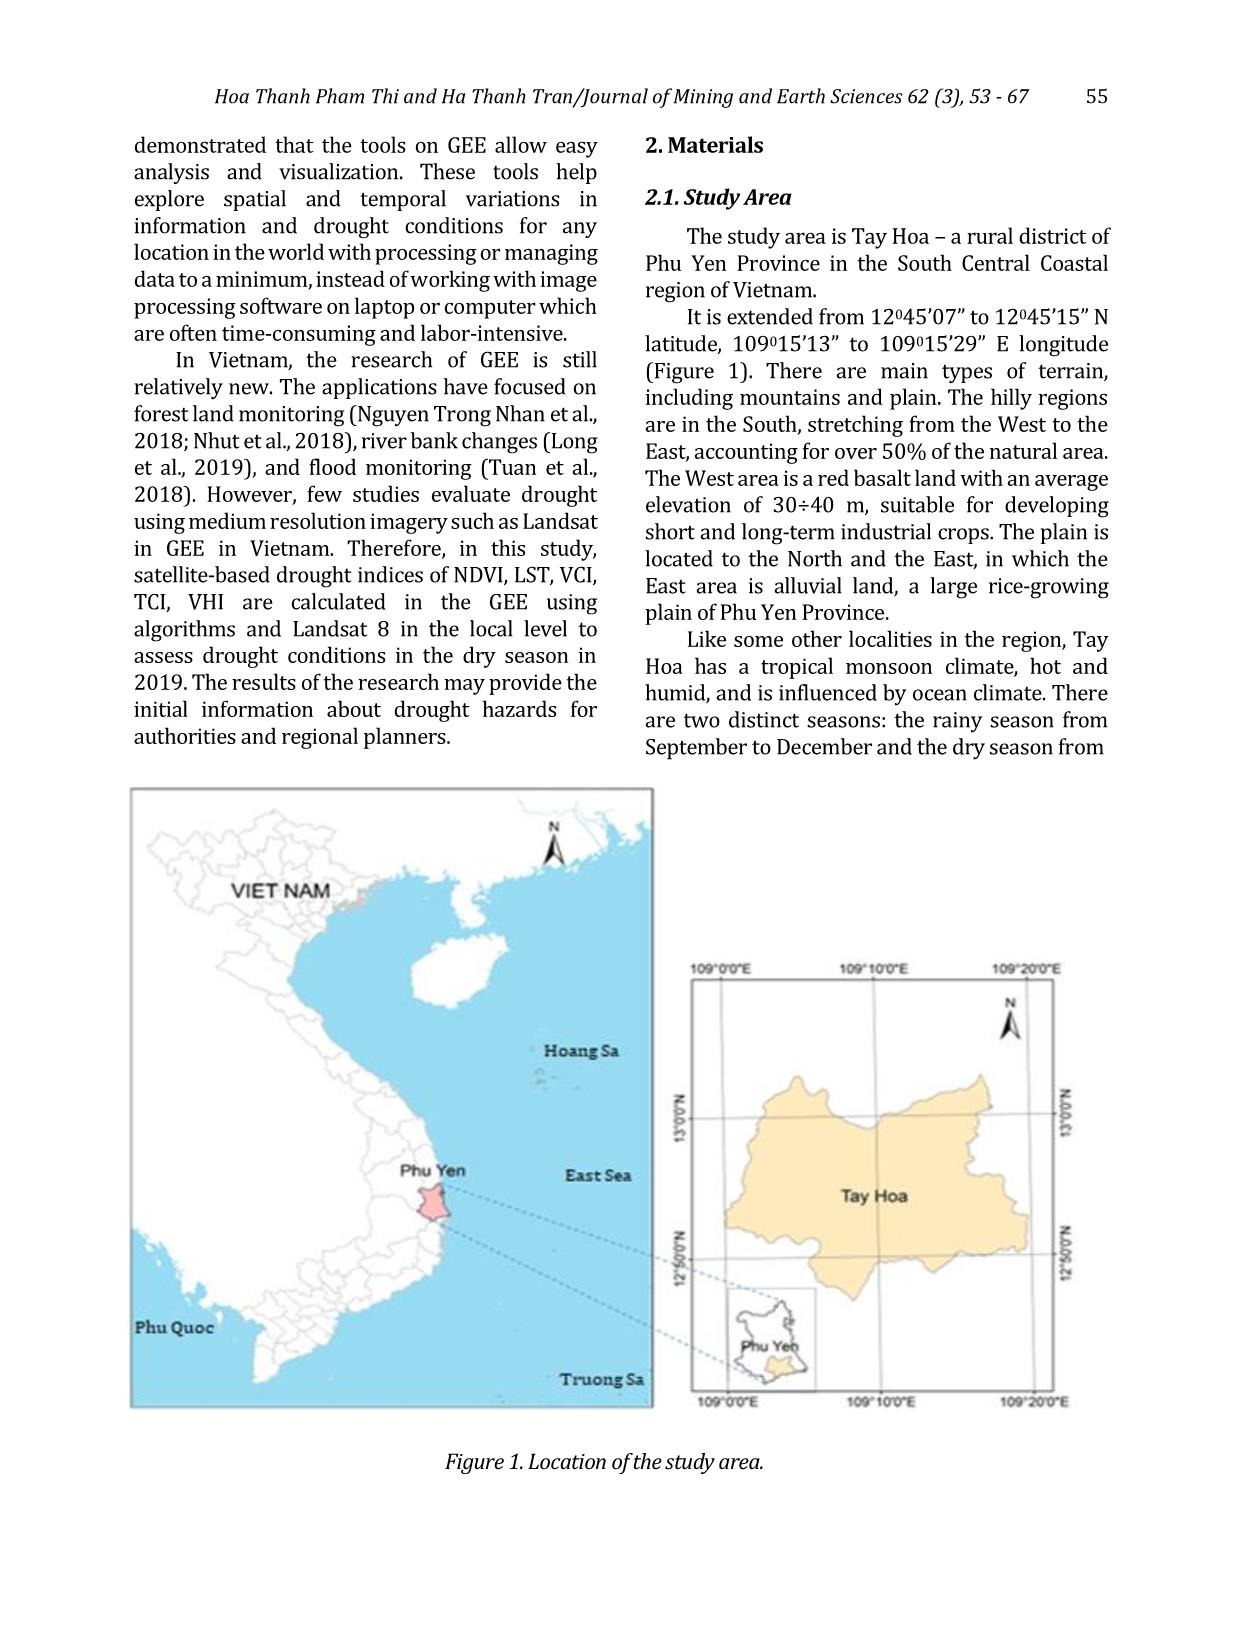
Faculty of Geomatics and Land Administration, Hanoi University of Mining and Geology, Vietnam
ARTICLE INFO
ABSTRACT
Article history:
Received 16th Jan. 2021
Accepted 24th May 2021
Available online 30th Jun. 2021
 In Vietnam, drought is one of the natural disasters caused by high
temperatures and lack of precipitation, especially with El Nino and the
global warming phenomenon. It affects directly environmental,
economical, social issues, and the lives of humans. Many methods have
been used to assess drought, in which remote sensing indices are
considered the most commonly used tool today. They are used to analyze
spatio-temporal distribution of drought conditions and identify drought
severity. Especially with the launch of Google Earth Engine (GEE) - a
cloud-based platform for geospatial analysis, it is easy to access high-
performance computing resources for processing multi-temporal satellite
data online. With the GEE platform, we focus on writing and running
scripts with the indicators suitable for evaluating drought phenomenon,
instead of calculating on software and downloading remote sensing
imagery with large size. In this study, we collected 26 Landsat 8 images in
the dry season in 2019 (from April to July) in Tay Hoa district, Phu Yen –
a region in the South Central Coast of Vietnam where agricultural
drought occurs frequently. We assessed the distribution of drought
conditions by using a drought index (VHI index – Vegetation Health Index)
produced from Landsat satellite data in the GEE platform. The study
results indicated that the drought (from mild to severe) concentrated in
the North of the region, corresponding to high surface temperature and
NDVI low or NDVI moderate values. VHI maps were visually compared
with the drought map of the South Central Coast and the Central
Highlands. In general, the results also reflect the the method’s reliability
and can be used to support the managers to plan policies, making long-
term plans to cope with climate change in the future at Tay Hoa in
particular and other regions in general.
Copyright © 2021 Hanoi University of Mining and Geology. All rights reserved.
Keywords:
Drought,
Google Earth Engine,
Remote sensing,
Tay Hoa,
VHI.
_____________________
*Corresponding author
E-mail: phamthithanhhoa@humg.edu.vn
DOI: 10.46326/JMES.2021.62(3).07
54 Hoa Thanh Pham Thi and Ha Thanh Tran/Journal of Mining and Earth Sciences 62 (3), 53 - 67
1. Introduction
In recent times, climate change are the main
reasons which caused global warming, the lack of
rainfall, making the drought more serious. This
phenomenon greatly impacts agriculture such as
reducing crop productivity, reducing cultivated
areas and crop yields, mainly food crops.
Therefore, identifying of drought extent is
considered an important program to assess the
drought occurrence and its severity to agriculture
development in Vietnam.
Although drought types occur at different
timescales as usual, it is detected in the dry season
with precipitation shortages, high temperatures
(Wilhite, 2000). Besides, it often happens in large
areas. Therefore, many scientists worldwide have
recognized the potential of using indices observed
from remote sensing data to monitor drought
effectively. The main reason was given as remote
sensing technology provides a synoptic view of
the Earth’s surface. The advantage of technology
is that image data is delivered continuously over
time and whole the globe, so the details of the
results are shown legibly with different regions,
more efficient than the measurement with the
monitoring point. The use of remote sensing data
to establish drought maps will provide an
overview of the space of drought areas for the
regions where there are no or few meteorological
stations and there is a variety of free satellite
imagery suitable for evaluating drought
conditions, such as MODIS and LANDSAT.
Among drought indices derived from remote
sensing data, the Normalized Difference
Vegetation Index (NDVI) combined with Land
Surface Temperature (LST) provides a strong
correlation. It gives valuable information to
identify agricultural drought (Sruthi et al., 2015).
Based on NDVI and LST relationship, many
drought indices were introduced, such as
Temperature – Vegetation Dryness Index (TVDI),
Vegetation Health Index (VHI), Water Supplying
Vegetation Index (WSVI), and tested successfully
in many countries (Alshaikh, 2015; Schirmbeck et
al., 2017; Sholihah et al., 2016). VHI demonstrated
a greater capability and better suitability in
monitoring drought (Bento et al., 2018). It
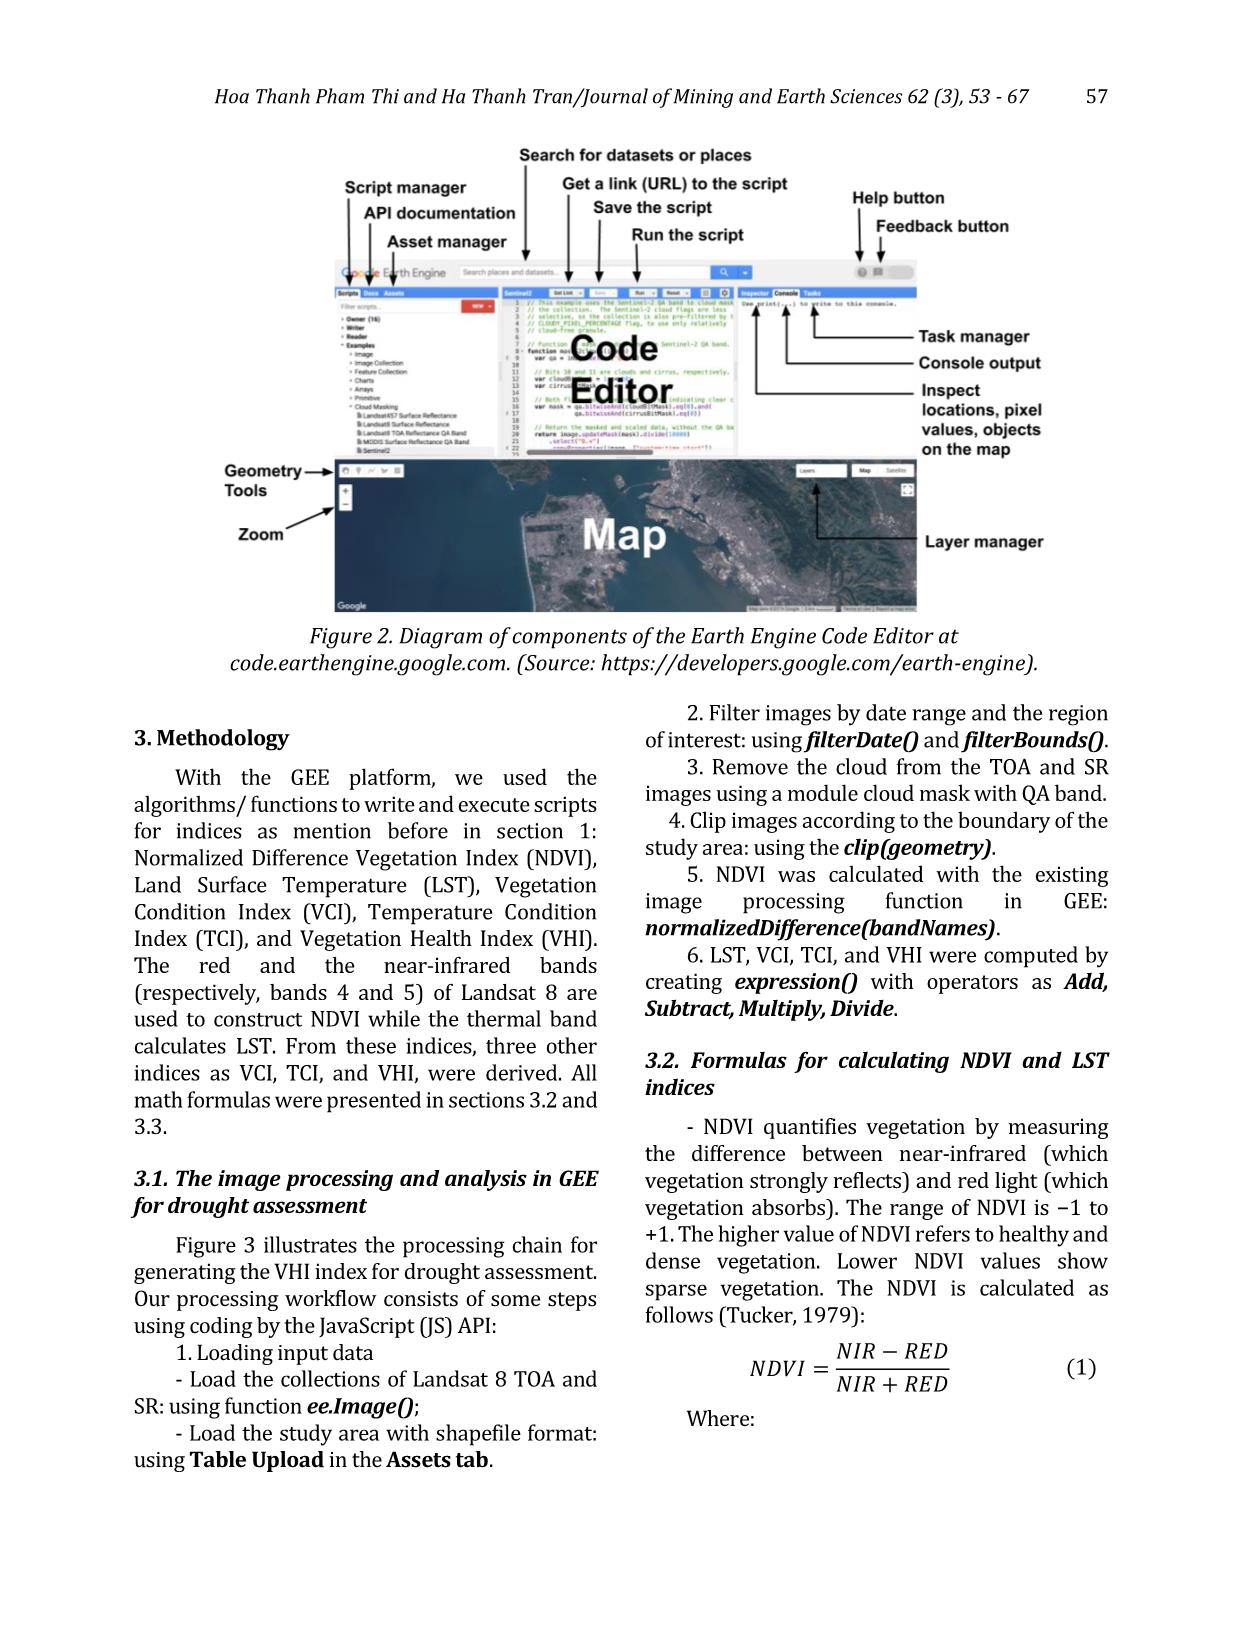
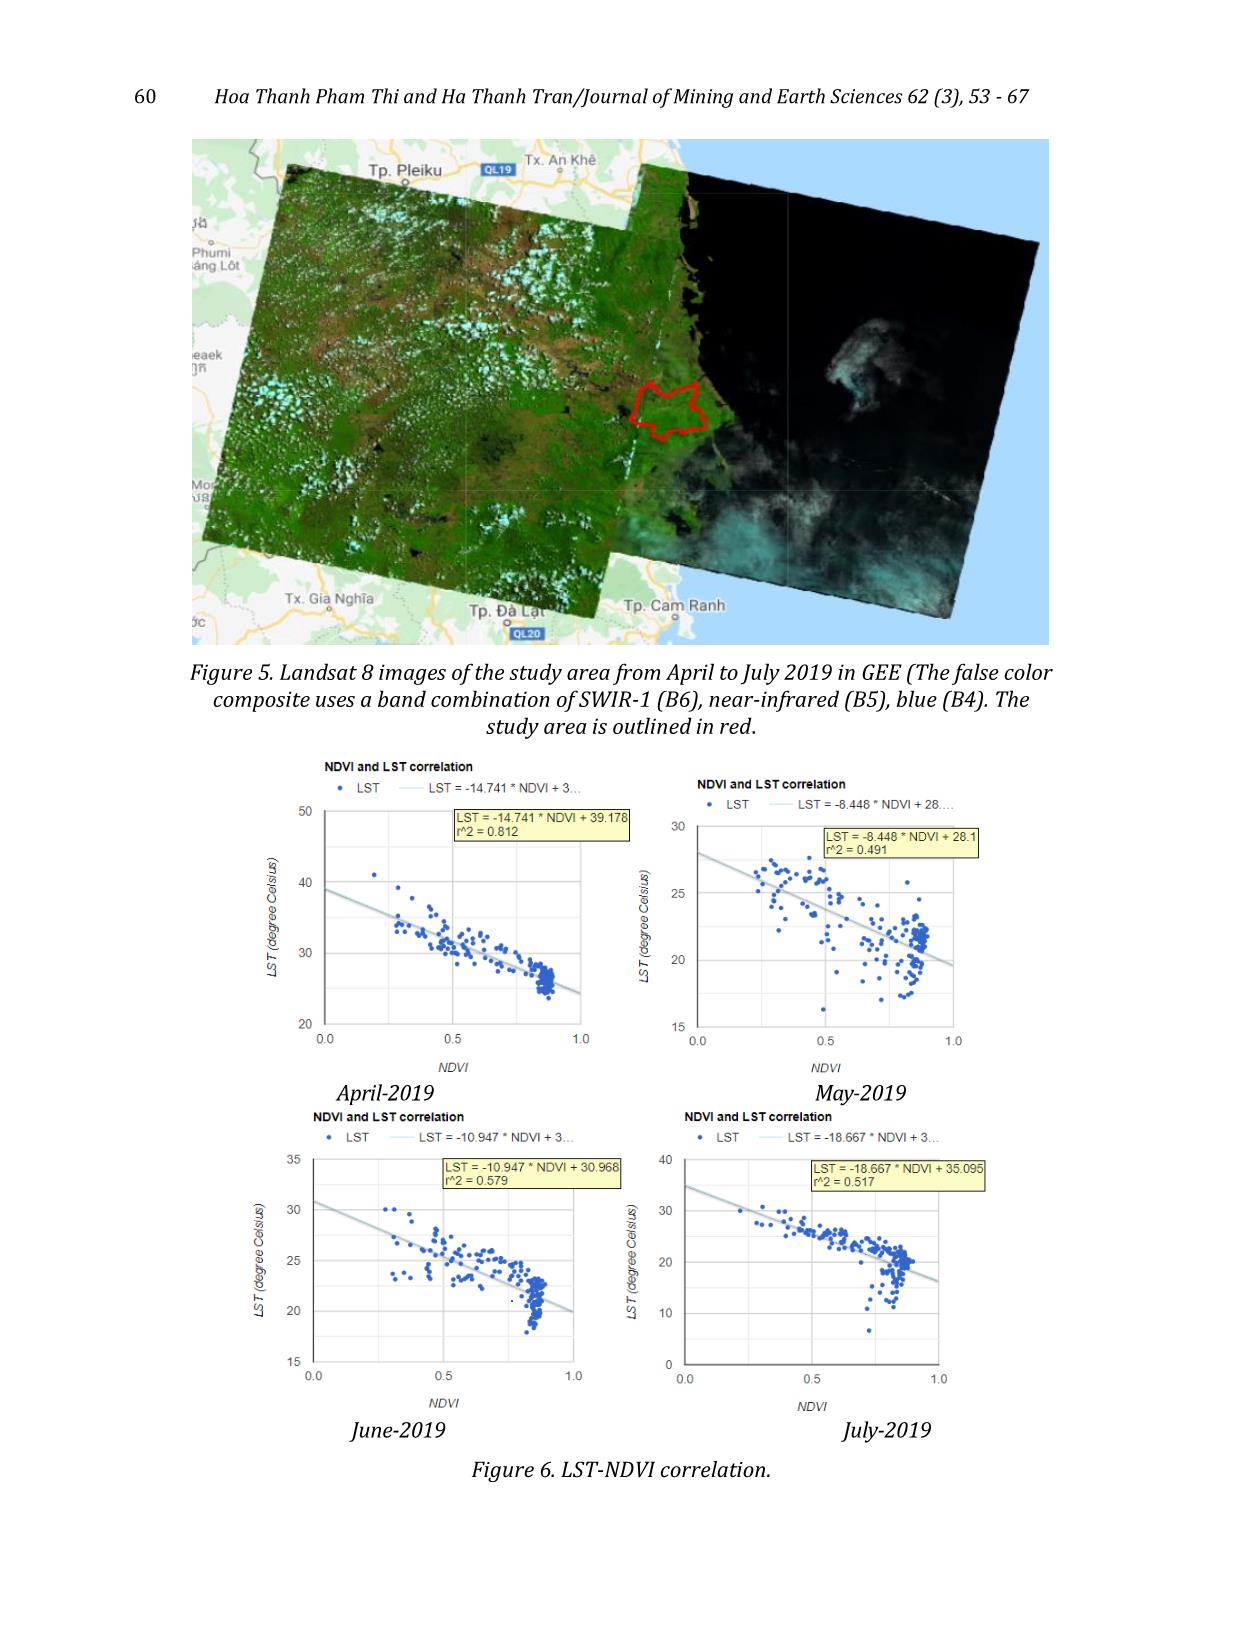
combines two indices: Veget ... ation state. Overall, they are also
considered tools for monitoring drought periods.
NDVI at a given pixel will typically be relatively
low, whereas LST is expected to be relatively high
because of vegetation deterioration.
4.2. Spatial drought
Figure 8 represents the spatial distribution of
VCI, TCI, and VHI. TCI and VCI were created based
on the condition that the higher the temperature,
the worse the conditions for vegetation. High
values of VCI signify good vegetation; on the
contrary, its values decrease to 0 show extremely
unfavorable vegetation conditions. Low TCI
values indicate harsh weather conditions (due to
high temperatures), and high values (close to
100) reflect mostly favorable conditions.
Generally, the results show TCI, VCI, and VHI
had a similar pattern from April to July in 2019,
with values close to 0 in the North and values
increase to 100 in the South of the studied area.
Moreover, the distribution of drought
phenomenon over the dry season period in 2019
is shown in Figure 9 with four levels: from no
drought to severe (white to red, respectively). The
forests are distributed in the South of Tay Hoa
district and were not affected by drought (VHI
values >40). From April to July 2019, the
vulnerable to drought areas tended to increase,
mainly in Son Thanh Dong, Son Thanh Tay, Hoa
My Dong, Hoa Binh 1, Hoa Binh 2, and Hoa Phong,
where land is used for agriculture (by overlaying
VHI map with land use map of Tay Hoa). Besides,
the total drought area is recorded for 17÷20% of
the entire district, corresponding to the site with
high surface temperature from 25÷300C and NDVI
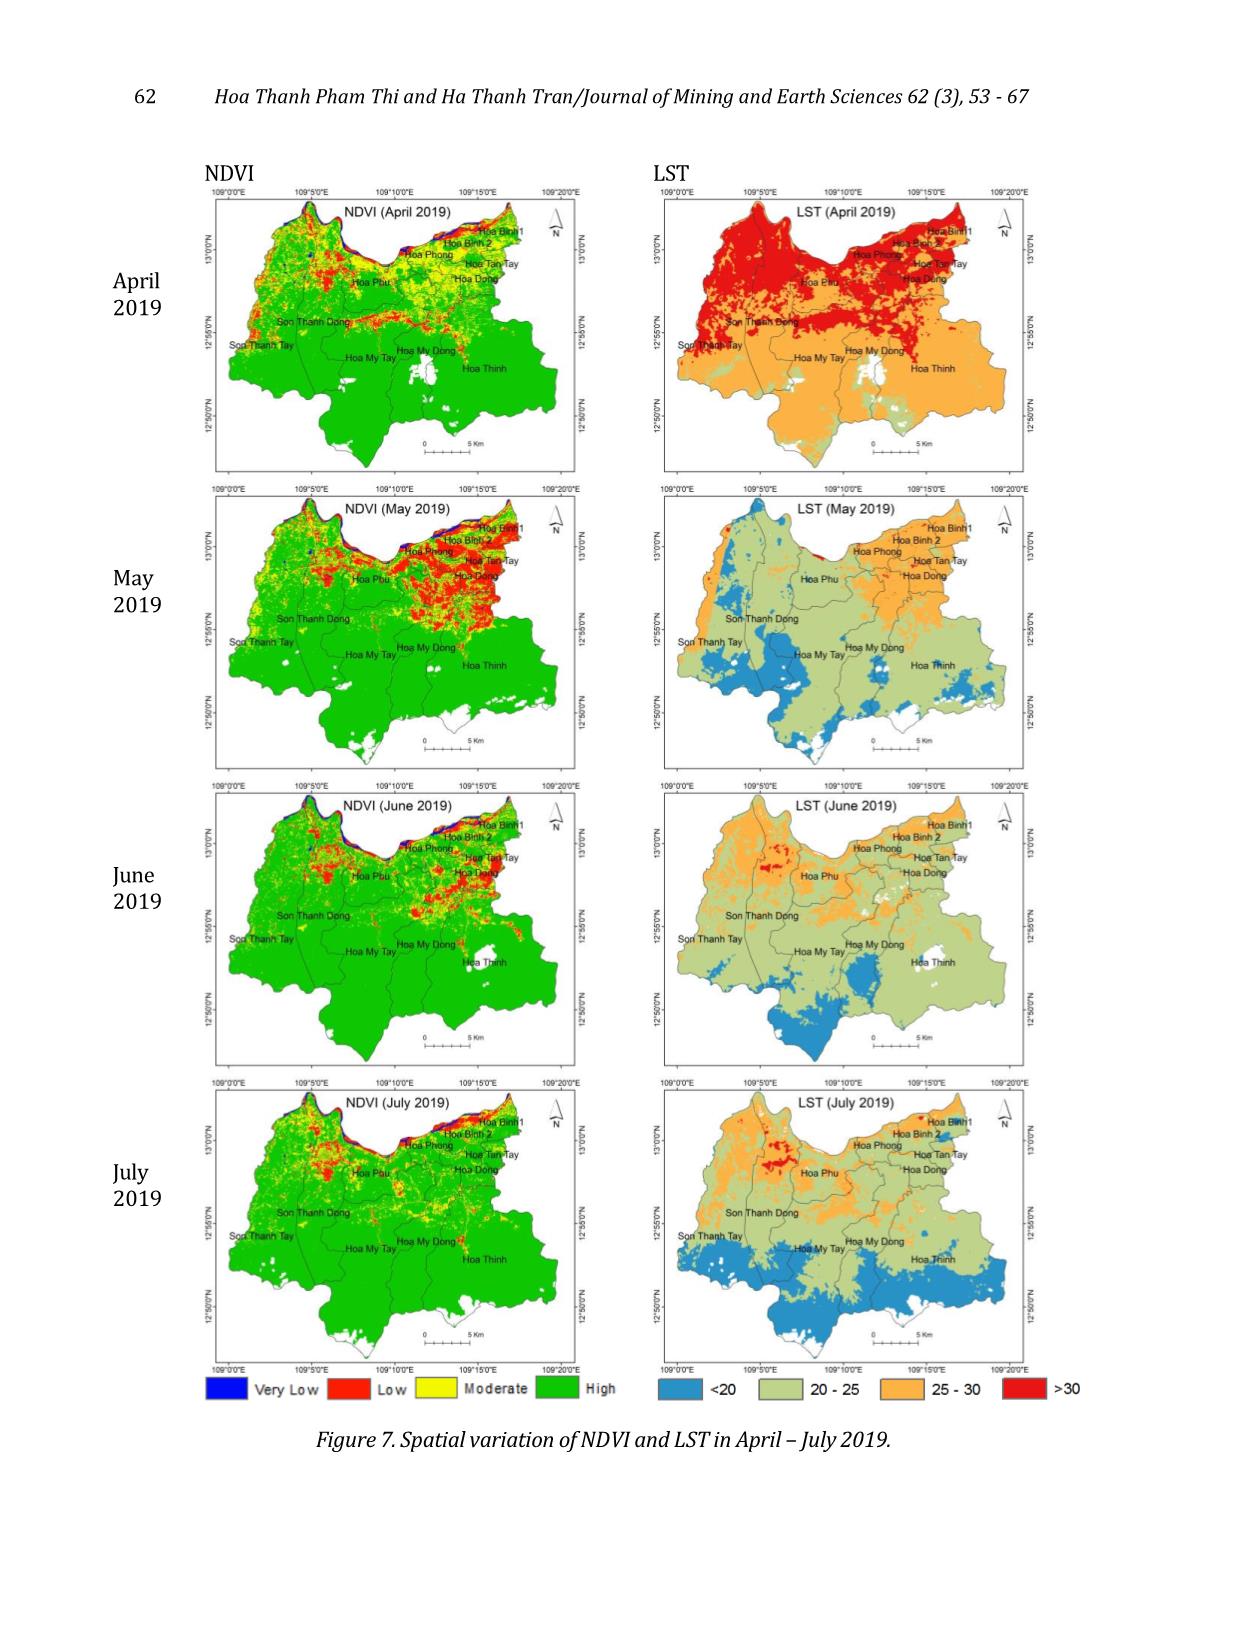
low or NDVI moderate values (Figure 7). Overall,
the VHI index is chosen to assess the drought of
vegetation caused by temperature. Therefore, it is
appropriate to indicate the extent of agricultural
drought.
To assess the accuracy of the results of
agricultural drought using the VHI index by
coding in the GEE platform, we made the
following comparisons:
1. Due to the limitation of observational data
in the study area, we compared LST images in the
study with LST from MOD11A1 V6 data which
were provided directly on GEE (see
https://developers.google.com/earth-
engine/datasets/catalog/MODIS_006_MOD11A1
?hl=en). The comparison results between
retrieved LST from Landsat 8 and Modis LST
revealed a good correlation (values R2 > 0.67).
Although the comparison is not entirely valid
because the resolution of the MOD11A1 V6
product is low, it shows that free Landsat 8
imagery sources helpd calculate LST
approprivately in small areas.
2. Comparing drought conditions between
VHI index map of Tay Hoa district with the Palmer
map (PDSI - Palmer Drought Severity Index) of the
South Central Coast and the Central Highlands.
This map was published in 2016 and was a result
of the project of Vietnam Academy for Water
62 Hoa Thanh Pham Thi and Ha Thanh Tran/Journal of Mining and Earth Sciences 62 (3), 53 - 67
 NDVI LST
April
2019
May
2019
June
2019
July
2019
Figure 7. Spatial variation of NDVI and LST in April – July 2019.
 Hoa Thanh Pham Thi and Ha Thanh Tran/Journal of Mining and Earth Sciences 62 (3), 53 - 67 63
 VCI TCI
April
2019
May
2019
June
2019
July
2019
 Figure 8. VCI and TCI in Tay Hoa district in dry season 2019.
64 Hoa Thanh Pham Thi and Ha Thanh Tran/Journal of Mining and Earth Sciences 62 (3), 53 - 67
Resource. While VHI uses LST and NDVI extracted
from remote sensing for monitoring agricultural
drought, PDSI uses readily available temperature
and precipitation data series (Alley, 1984; Palmer,
1965). The drought in 2016 occurred in most
provinces of the south - central coast and the
central highlands in general and Tay Hoa district
in particular, while the drought results in 2019 in
the study mainly occurred in the northern regions
of Tay Hoa. Although there are no similarities in
space, time and index, the comparison is also
found that drought area in 2019, also existed in
2016. Besides, we overlayed the VHI map with the
land use map of Tay Hoa. Therefore, the results of
the areas identified as drought are consistent with
the reality of crop regions. Overall, the results also
reflect the method’s reliability, especially in the
absence of meteorological information in the area.
5. Conclusion
This study assessed drought conditions in a
relatively small rural area in the south - central
coastal of Vietnam during the dry season. The
method relies on Google Earth Engine and
algorithms/scripts to analyze and calculate the
Vegetation Health Index (VHI) - drought index.
Our results confirm that from April to July 2019,
the preliminary information about the spatial
distribution of mild, moderate, and severe
drought in the Tay Hoa district was provided
quickly. Futhermore, it shows the potential of
using GEE to monitor drought. The GEE data
catalog includes all the Landsat imagery and
replaces all the heavy computational processes
with advanced cloud computing technologies, the
results obtained for a short time. The Google Earth
Figure 9. Spatial distribution of drought with VHI index.
 Hoa Thanh Pham Thi and Ha Thanh Tran/Journal of Mining and Earth Sciences 62 (3), 53 - 67 65
Engine methodology that we developed in this
research will contribute to assessing and
monitoring drought for Tay Hoa district.
However, this method also has the
disadvantages: it depends on selecting of suitable
Landsat 8 images for the study area. Images with
a large cloud cover will not be selected because
the information about drought at this time will be
lost. Therefore, to solve this combining different
types of satellite imagery in GEE (Landsat,
Sentinel, Modis) and adding the parameters to
indicate drought conditions, such as water
capacity and rainfall.
Acknowledgment
The authors would like to thank the Hanoi
University of Mining and Geology for funding this
research in Project No T20-10.
Author contributions
Pham Thi Thanh Hoa: Conceived the idea,
performed the analytic calculations, wrote the
manuscript. Tran Thanh Ha: analyzed the data
and formulas, commented and edited this
manuscript.
References
Aksoy, S., Gorucu, O.,Sertel, E., (2019). Drought
Monitoring using MODIS derived indices and
Google Earth Engine Platform. Paper presented
at the 2019 8th International Conference on
Agro-Geoinformatics (Agro-Geoinformatics). 1-
6. doi: 10.1109/Agro-
Geoinformatics.2019.8820209.
Alley, W., (1984). The Palmer Drought Severity
Index: Limitations and Assumptions. Journal of
Climate and Applied Meteorology, 23, 1100-
1109. doi: 10.1175/1520-
0450(1984)0232.0.CO;2.
Alshaikh, A. Y., (2015). Space applications for
drought assessment in Wadi-Dama (West
Tabouk), KSA. The Egyptian Journal of Remote
Sensing and Space Science, 18(1, Supplement
1), S43-S53. doi:
https://doi.org/10.1016/j.ejrs.2015.07.001.
Bento, V., Gouveia, C., Dacamara, C.,Trigo, I.,
(2018). A climatological assessment of
drought impact on vegetation health index.
Agricultural and Forest Meteorology, 259, 286-
295. doi: 10.1016/j.agrformet.2018.05.014.
Chander, G., Markham, B. L.,Helder, D. L., (2009).
Summary of current radiometric calibration
coefficients for Landsat MSS, TM, ETM+, and
EO-1 ALI sensors. Remote Sensing of
Environment, 113(5), 893-903. doi:
https://doi.org/10.1016/j.rse.2009.01.007.
Department of Natural Resources and
Environment of Phu Yen Province, (2019).
Climate assessment reports of Phu Yen
province (in Vietnamese).
DeVries, B., Huang, C., Armston, J., Huang, W.,
Jones, J.,Lang, M., (2020). Rapid and robust
monitoring of flood events using Sentinel-1
and Landsat data on the Google Earth Engine.
Remote Sensing of Environment, 240. doi:
10.1016/j.rse.2020.111664.
Ferrelli, F., Huamantinco Cisneros, M., Delgado,
A.,Piccolo, M., (2018). Spatial and temporal
analysis of the LST-NDVI relationship for the
study of land cover changes and their
contribution to urban planning in Monte
Hermoso, Argentina. Documents d'Anàlisi
Geogràfica, 64, 25. doi: 10.5565/rev/dag.355.
Gorelick, N., Hancher, M., Dixon, M., Ilyushchenko,
S., Thau, D.,Moore, R., (2017). Google Earth
Engine: Planetary-scale geospatial analysis for
everyone. Remote Sensing of Environment, 202,
18-27. doi:
https://doi.org/10.1016/j.rse.2017.06.031.
Gorgani, S., Panahi, M.,Rezaie, F., (2013). The
Relationship between NDVI and LST in the
urban area of Mashhad, Iran. Paper presented
at the International Conference on Civil
Engineering Architecture & Urban Sustainable
Development. At Tabriz , Iran.
Khan, R., Gilani, H., Iqbal, N.,Shahid, I., (2019).
Satellite-based (2000–2015) drought hazard
assessment with indices, mapping, and
monitoring of Potohar plateau, Punjab,
Pakistan. Environmental Earth Sciences, 79(1),
23. doi: 10.1007/s12665-019-8751-9.
Kogan, F. N., (1995). Application of vegetation
index and brightness temperature for drought
detection. Advances in Space Research, 15(11),
66 Hoa Thanh Pham Thi and Ha Thanh Tran/Journal of Mining and Earth Sciences 62 (3), 53 - 67
91-100. doi: https://doi.org/10.1016/0273-
1177(95)00079-T.
Kogan, F. N., (2000). Satellite-Observed Sensitivity
of World Land Ecosystems to El Niño/La Niña.
Remote Sensing of Environment, 74, 445-462.
doi: 10.1016/S0034-4257(00)00137-1.
Long, V. H., Giang, N. V., Hoanh, T. P.,Hoa, P. V.,
(2019). Applying Google Earth Engine in river
bank erosion monitoring – a case study in
lower Mekong river (in Vietnamese). Journal of
science- Ho Chi Minh city University of
Education.
Masitoh, F.,Rusydi, A. N., (2019). Vegetation
Health Index (VHI) analysis during drought
season in Brantas Watershed. IOP Conference
Series: Earth and Environmental Science, 389,
012033. doi: 10.1088/1755-
1315/389/1/012033.
Midekisa, A., Holl, F., Savory, D. J., Andrade-
Pacheco, R., Gething, P. W., Bennett,
A.,Sturrock, H. J. W., (2017). Mapping land
cover change over continental Africa using
Landsat and Google Earth Engine cloud
computing. PLOS ONE, 12(9), e0184926. doi:
10.1371/journal.pone.0184926.
Mutanga, O.,Kumar, L., (2019). Google Earth
Engine Applications. Remote Sensing, 11, 591.
doi: 10.3390/rs11050591.
Nguyen Trong Nhan,Cuong, V. X., (2018). Google
Earth Engine was applied to forest land
monitoring in Lam Dong province from 2010 -
2016 (in Vietnamese). The fourth Scientific
Conference - SEMREGG 2018, 258-265.
Nguyen Viet Lanh, Dung, N. V., Duong, T. H.,Tam, T.
T., (2018). Using satellite precipitation data to
assess meteorological drought based on SPI
index for Thanh Hoa province. Vietnam Journal
of Hydro - Meteorology, 696, 1-9.
Nhut, H. S., Hoa, P. V., Binh, N. A., An, N. N., Phuong,
T. A.,Thao, G. T. P., (2018). Using Google Earth
Engine for assessing mangrove forest change
in Ngoc Hien district, Ca Mau province in the
period 2000-2015 (in Vietnamese). Journal of
science- Ho Chi Minh city University of
Education, 15(11b), 101-107.
Online Vietnam Agriculture Newspaper. (2019).
https://nongnghiep.vn/phu-yen-han-han-
khoc-liet-mot-xa-thieu-nuoc-nghiem-trong-
d247764.html.
Palmer, W. C., (1965). Meteorological Drought.
Research Paper No. 45, US Weather Bureau,
Washington, DC.
Sazib, N., Mladenova, I.,Bolten, J., (2018).
Leveraging the Google Earth Engine for
Drought Assessment Using Global Soil
Moisture Data. Remote Sensing, 10, 1265. doi:
10.3390/rs10081265.
Schirmbeck, L. W., Fontana, D. C., Schirmbeck,
J.,Mengue, V. P., (2017). Understanding TVDI as
an index that expresses soil moisture. Journal
of Hyperspectral Remote Sensing, 7, 82-90.
Sholihah, R., Trisasongko, B., Shiddiq, D., Iman, L.
O., Kusdaryanto, S., Manijo,Panuju, D., (2016).
Identification of Agricultural Drought Extent
Based on Vegetation Health Indices of Landsat
Data: Case of Subang and Karawang, Indonesia.
Procedia Environmental Sciences, 33, 14-20.
doi: 10.1016/j.proenv.2016.03.051
Sidhu, N., Pebesma, E.,Câmara, G., (2018). Using
Google Earth Engine to detect land cover
change: Singapore as a use case. European
Journal of Remote Sensing, 51, 486-500. doi:
10.1080/22797254.2018.1451782
Sobrino, J. A., Jiménez-Muñoz, J. C.,Paolini, L.,
(2004). Land surface temperature retrieval
from LANDSAT TM 5. Remote Sensing of
Environment, 90(4), 434-440. doi:
https://doi.org/10.1016/j.rse.2004.02.003.
Sreekesh, S., Kaur, N.,Sreerama Naik, S. R., (2019).
Agricultural drought and soil moisture
analysis using satellite image based indices.
Int. Arch. Photogramm. Remote Sens. Spatial Inf.
Sci., XLII-3/W6, 507-514. doi: 10.5194/isprs-
archives-XLII-3-W6-507-2019.
Sruthi, S.,Aslam, M. A. M., (2015). Agricultural
Drought Analysis Using the NDVI and Land
Surface Temperature Data; a Case Study of
Raichur District. Aquatic Procedia, 4, 1258-
1264. doi:
https://doi.org/10.1016/j.aqpro.2015.02.164
 Hoa Thanh Pham Thi and Ha Thanh Tran/Journal of Mining and Earth Sciences 62 (3), 53 - 67 67
Sunar, F., Yağmur, N.,Dervisoglu, A., (2019). Flood
Analysis with Remote Sensing Data - a Case
Study: Maritsa River, Edirne. ISPRS -
International Archives of the Photogrammetry,
Remote Sensing and Spatial Information
Sciences, XLII-3/W8, 497-502. doi:
10.5194/isprs-archives-XLII-3-W8-497-2019.
Tran, H. T., Campbell, J. B., Tran, T. D.,Tran, H. T.,
(2017). Monitoring drought vulnerability
using multispectral indices observed from
sequential remote sensing (Case Study: Tuy
Phong, Binh Thuan, Vietnam). GIScience &
Remote Sensing, 54(2), 167-184. doi:
10.1080/15481603.2017.1287838.
Tuan, V. Q., Khai, D. H., Nhan, H. T. K.,Hoa, N. T.,
(2018). Development of flood monitoring
algorithms in the Mekong Delta based on
Google Earth Engine platform (in Vietnamese).
Can Tho University Journal of Science, 54(9A),
29-36.
Tucker, C. J., (1979). Red and photographic
infrared linear combinations for monitoring
vegetation. Remote Sensing of Environment,
8(2), 127-150. doi:
https://doi.org/10.1016/0034-
4257(79)90013-0.
Vermote, E., Justice, C., Claverie, M.,Franch, B.,
(2016). Preliminary analysis of the
performance of the Landsat 8/OLI land surface
reflectance product. Remote Sensing of
Environment, Volume 185(Iss 2), 46-56. doi:
10.1016/j.rse.2016.04.008.
Weng, Q., Lu, D.,Schubring, J., (2004). Estimation
of land surface temperature–vegetation
abundance relationship for urban heat island
studies. Remote Sensing of Environment, 89(4),
467-483. doi:
https://doi.org/10.1016/j.rse.2003.11.005.
Wilhite, D., (2000). Drought as a Natural Hazard:
Concepts and Definitions. Drought, a Global
Assessment, 1.
File đính kèm:
 application_of_remote_sensing_imagery_and_algorithms_in_goog.pdf

