Tính chất quang của các chấm lượng tử Graphene pha tạp Nitơ và Lưu huỳnh
Các chấm lượng tử Graphene (GQDs) là loại vật liệu có kích thước nano mét (nm) và chiều dày chỉ là đơn lớp hay vài
lớp nguyên tử carbon (C) sắp xếp thành mạng lục giác (hecxagonal) kiểu tổ ong. Do cấu trúc mạng của chấm lượng tử
graphene chỉ gồm các nguyên tử carbon, vì vậy GQDs là vật liệu nano thân thiện với môi trường và con người. Chúng
có nhiều ứng dụng mà một trong những ứng dụng chính trong y sinh là làm tác nhân kháng khuẩn mới. Việc pha tạp các
nguyên tử chất khác vào mạng GQD là một phương pháp hiệu quả để thay đổi mức năng lượng khuyết tật của GQDs,
để điều khiển và làm thay đổi các tính chất quang và truyền điện tử của GQDs. Trong bài báo này, chúng tôi trình bày
các kết quả mới về việc tổng hợp GQDs pha tạp nitơ (N-GQDs) và GQDs pha tạp lưu huỳnh (S-GQDs) và các tính chất
quang học tương ứng của chúng, như phổ hấp thụ, huỳnh quang, phổ Raman. Cơ chế huỳnh quang của các mẫu GQDs,
N-GQDs, S-GQDs sẽ được làm rõ và giải thích. Hai loại chấm lượng tử này là những ứng viên sáng giá cho các ứng
dụng làm chất kháng khuẩn trong y sinh và hiện ảnh sinh học.
Từ khóa: Chấm lượng tử Graphene pha tạp; GQDs; N-GQDs; S-GQDs; Tính chất quang; Huỳnh quang; Raman.
Trang 1
Trang 2
Trang 3
Trang 4
Trang 5
Trang 6
Tóm tắt nội dung tài liệu: Tính chất quang của các chấm lượng tử Graphene pha tạp Nitơ và Lưu huỳnh
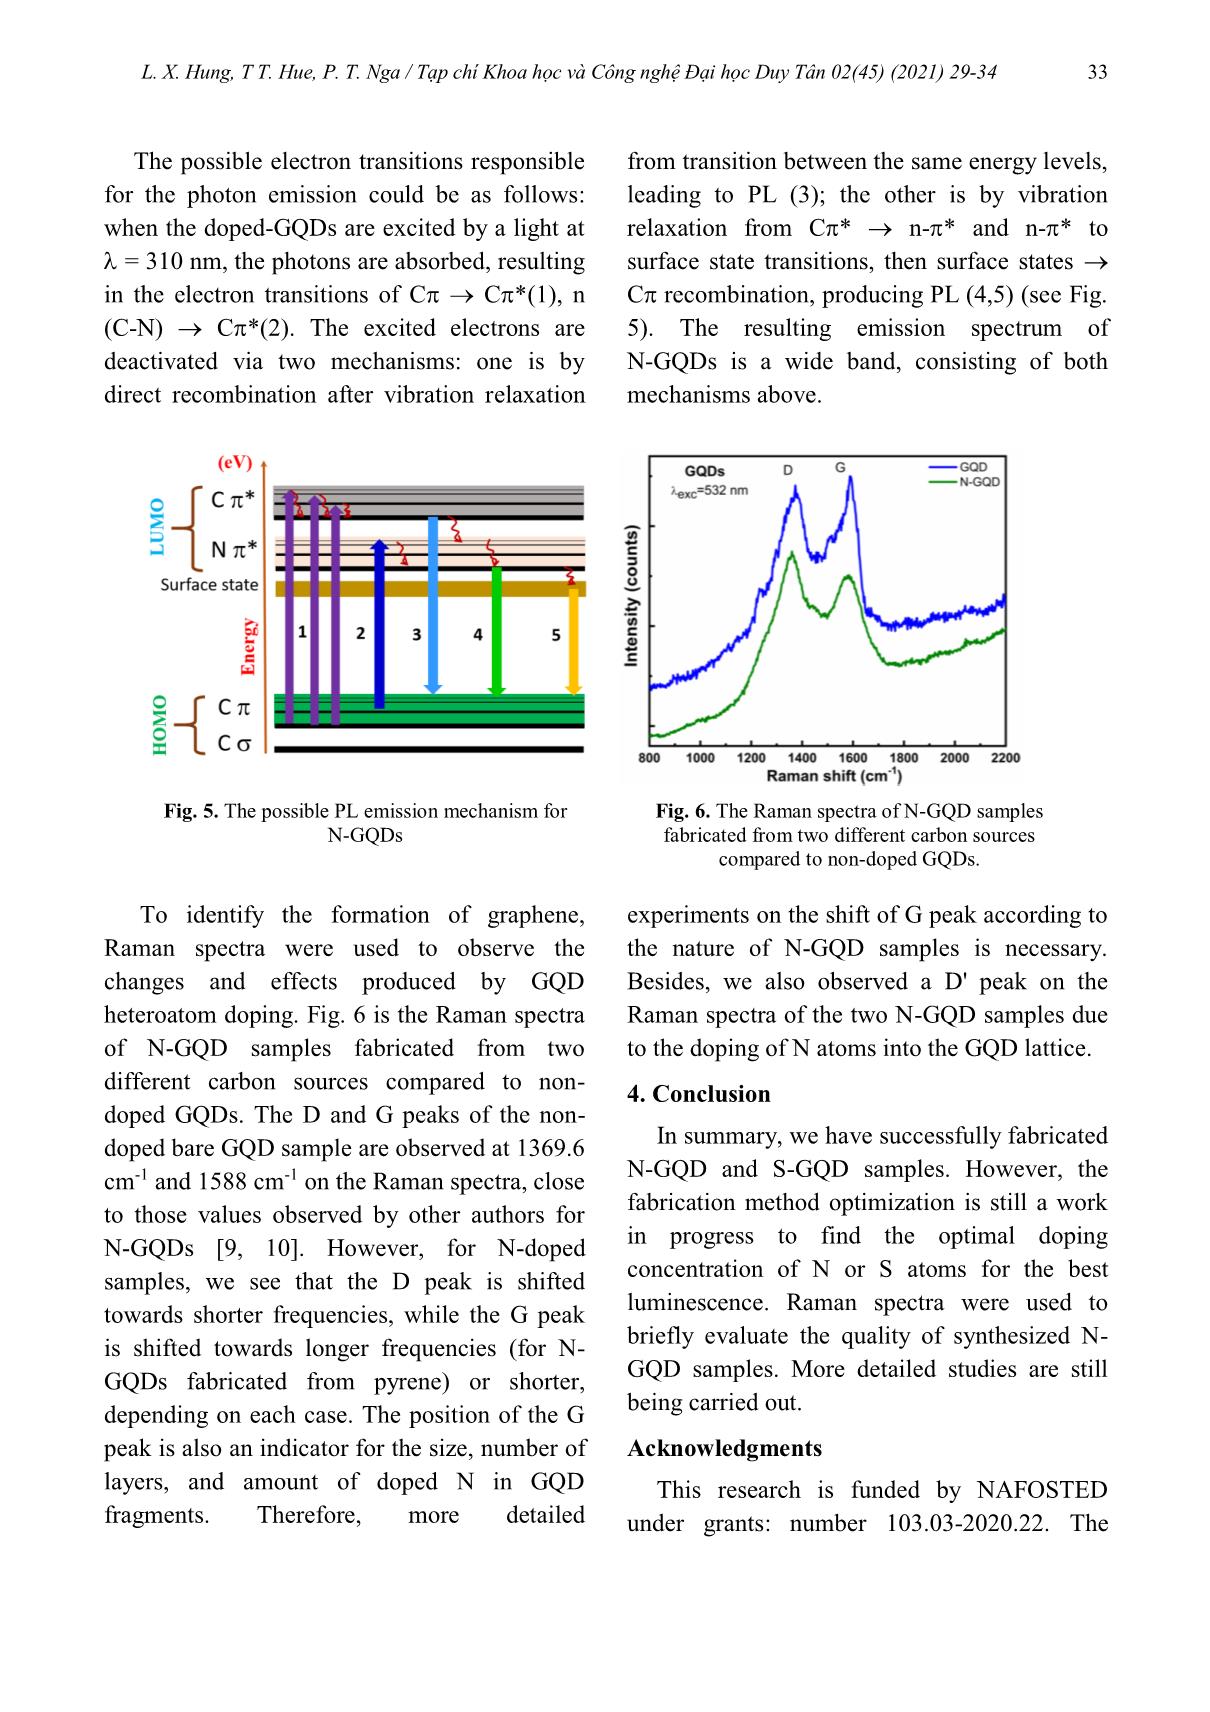
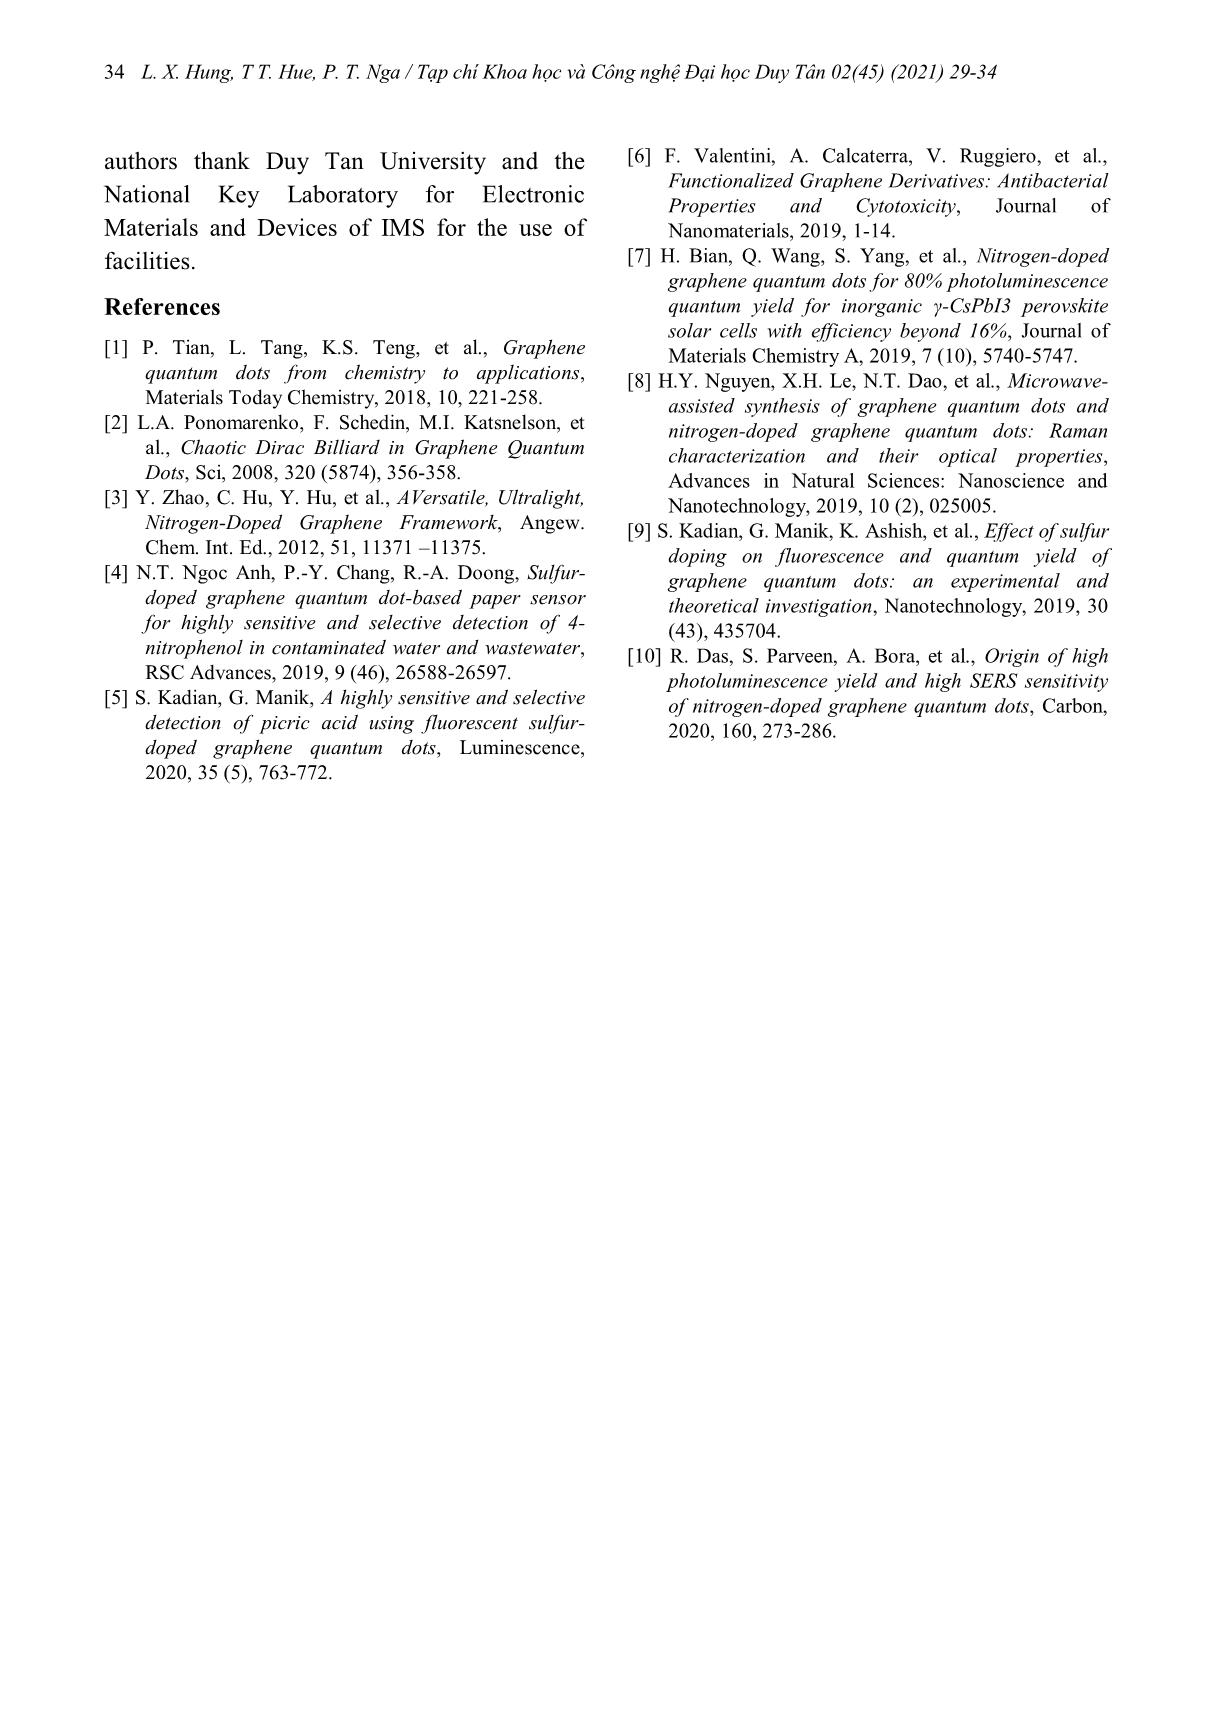
L. X. Hung, T T. Hue, P. T. Nga / Tạp chí Khoa học và Công nghệ Đại học Duy Tân 02(45) (2021) 29-34 29 02(45) (2021) 29-34 Optical properties of Nitrogen and Sulfur doped Graphene quantum dots Tính chất quang của các chấm lượng tử Graphene pha tạp Nitơ và Lưu huỳnh Le Xuan Hunga,b*, Trinh Thi Hueb,c, Pham Thu Ngab,c Lê Xuân Hùnga,b*, Trịnh Thị Huếb,c, Phạm Thu Ngab,c aInstitute of Research and Development, Duy Tan University, Da Nang, 550000, Vietnam aViện Nghiên cứu và Phát triển Công nghệ Cao, Trường Đại học Duy Tân, Đà Nẵng, Việt Nam bFaculty of Natural Sciences, Duy Tan University, Da Nang, 550000, Vietnam bKhoa Khoa học Tự nhiên, Trường Đại học Duy Tân, Đà Nẵng, Việt Nam cInstitute of Theoretical and Applied Research, Duy Tan University, Hanoi, Vietnam cViện Nghiên cứu Lý thuyết và Ứng dụng, Trường Đại học Duy Tân, Hà Nội, Việt Nam (Ngày nhận bài: 03/12/2020, ngày phản biện xong: 07/01/2020, ngày chấp nhận đăng: 12/03/2021) Abstract Graphene Quantum Dots (GQDs) are a type of material with a width of several nanometers (nm) and a thickness of a single layer or a few layers of carbon (C) atoms organized in hexagonal shape like a beehive. Since the lattice structure of GQDs only includes carbon atoms, they are a nanomaterial that is friendly to the environment and humans. They have many applications, with one of the main uses being a novel antimicrobial agent. Doping other elements into the GQD lattice is an effective method to alter the defective energy level of GQDs, allowing control and modification of their optical properties and electronic transmission. In this paper, we present new results on the synthesis of nitrogen-doped GQDs (N- GQDs) and sulfur-doped GQDs (S-GQDs) and their respective optical properties such as absorption spectra, fluorescence, and Raman spectra. The fluorescent mechanisms of GQDs, N-GQDs, and S-GQDs will also be clarified and explained. These two types of quantum dots are strong candidates for antimicrobial agents and biomedical imaging. Keywords: Doped Graphene Quantum Dots; GQDs; N-GQDs; S-GQDs; Optical Properties; Photoluminescence; Raman. Tóm tắt Các chấm lượng tử Graphene (GQDs) là loại vật liệu có kích thước nano mét (nm) và chiều dày chỉ là đơn lớp hay vài lớp nguyên tử carbon (C) sắp xếp thành mạng lục giác (hecxagonal) kiểu tổ ong. Do cấu trúc mạng của chấm lượng tử graphene chỉ gồm các nguyên tử carbon, vì vậy GQDs là vật liệu nano thân thiện với môi trường và con người. Chúng có nhiều ứng dụng mà một trong những ứng dụng chính trong y sinh là làm tác nhân kháng khuẩn mới. Việc pha tạp các nguyên tử chất khác vào mạng GQD là một phương pháp hiệu quả để thay đổi mức năng lượng khuyết tật của GQDs, để điều khiển và làm thay đổi các tính chất quang và truyền điện tử của GQDs. Trong bài báo này, chúng tôi trình bày các kết quả mới về việc tổng hợp GQDs pha tạp nitơ (N-GQDs) và GQDs pha tạp lưu huỳnh (S-GQDs) và các tính chất quang học tương ứng của chúng, như phổ hấp thụ, huỳnh quang, phổ Raman. Cơ chế huỳnh quang của các mẫu GQDs, N-GQDs, S-GQDs sẽ được làm rõ và giải thích. Hai loại chấm lượng tử này là những ứng viên sáng giá cho các ứng dụng làm chất kháng khuẩn trong y sinh và hiện ảnh sinh học. Từ khóa: Chấm lượng tử Graphene pha tạp; GQDs; N-GQDs; S-GQDs; Tính chất quang; Huỳnh quang; Raman. *Corresponding Author: Le Xuan Hung; Institute of Research and Development, Duy Tan University, Da Nang, 550000, Vietnam; Faculty of Naturals Sciences, Duy Tan University, Da Nang, 550000, Vietnam Email: lexuanhung@duytan.edu.vn 30 L. X. Hung, T T. Hue, P. T. Nga / Tạp chí Khoa học và Công nghệ Đại học Duy Tân 02(45) (2021) 29-34 1. Introduction obtain high-quality quantum dots to apply in Graphene materials with 2D forms have experiments for antibacterial activity. The aims attracted research from scientists all over the of this research are: studying the fabrication of world, thanks to their interesting physical GQDs doped with N and S atoms from different properties and high applicability, ever since the carbon sources; studying the morphology of two scientists Geim and Novoslov received a fabricated doped GQDs; studying the Nobel Prize in 2010. However, graphene also identification of the formation of graphene via has some limitations, such as zero bandgap, low its characteristic peaks and the effects of doping absorptivity, etc. [1]. Graphene quantum dots on these peaks; presenting the emission were first fabricated by Ponomarenko and mechanisms of processes that take place in these Geim [2]. GQDs have many new properties, samples. The optical properties of these two and their unique fluorescent properties attribute types of doped GQDs such as Raman spectra, to their quantum confinement effect. The photoluminescence excitation (PLE), and property modification capability of GQDs is photoluminescence (PL), will be presented in very important for various applications. detail and compared to non-doped GQDs. Besides, GQDs also exhibit good solubility in 2. Experiments water due to the large edge effect of GQDs, 2.1. Synthesis of N-GQDs and S-GQDs which can be modified by functional groups. Modification of GQD properties have been For S-GQDs, synthesis from CA and urea initially done by Zhao et al. [3] in 2012 by was reported in [8] and synthesis from CA and doping nitrogen (N) into GQDs. Currently, MPA was reported in [4, 5, 9]. For N-GQD GQD property modification via doping and synthesis from CA and urea, we liquefy CA edge functionalizing is a hot topic for research from solid form then pyrolyze this CA liquid [1], in which the GQDs are doped with atoms with urea by microwave at 560 W for 2 min. of different elements, such as P, N, B and S. After the pyrolysis process, this mixture is The doping not only changes the emission added to a 50 ml NaOH (10 mg/ml) solution. spectral bands but also increases the quantum The obtained liquid is as-synthesized N-GQDs. yield of doped GQDs. Specifically, doping with In a typical preparation procedure for S- sulfur atoms is quite difficult compared to other GQDs [5, 9], 300 μl MPA and 2.1 g CA are heteroatoms because of its electronegativity. mixed in a 50 mL beaker. The obtained mixture Until now, there have only been a handful of is put into a microwave at 560 W for 2 min. researches on the fabrication of S-doped GQDs The resulting mixture, which has a light brown (S-GQDs) reported for sensor applications [4, color, is then dripped into a 50 ml NaOH (10 5]. Both N-GQDs and S-GQDs have good mg/ml) solution under strong stirring. After 30 fluorescence and high potential in biomedical minutes, we obtain S-GQDs as the product. [6] and photoelectronic applications [7]. In this 2.2. Characterization of N-GQDs and S-GQDs study, we used a simple and cost-effective pyrolysis method to fabricate N-GQDs and S- A JEOL JEM-2100 high-resolution GQDs using citric acid (CA), urea, and 3- transmission electron microscope (HRTEM) mercaptopropionic acid (MPA) as the sources was used to characterize the GQDs and doped- for carbon, nitrogen (N), and sulfur (S) GQDs at an accelerating voltage of 200 kV. respectively. These are novel research results to Raman spectra were recorded by a HORIBA L. X. Hung, T T. Hue, P. T. Nga / Tạp chí Khoa học và Công nghệ Đại học Duy Tân 02(45) (2021) 29-34 31 XploRA micro-Raman system using a 532 nm (Horiba) using a Xenon 75 W light with a CCD excitation laser. The ultraviolet-visible (UV– detector. Vis) absorption spectra of doped-GQDs in 3. Results and discussion water were measured in the wavelength range 3.1. Morphology of doped-GQDs by HR-TEM of 200–1100 nm using a Cary 60 UV–Vis images spectrophotometer (Agilent). The PL spectra were recorded on a Fluorolog- 322 system The shape and size of the synthesized (Horiba Jobin-Yvon) using a Xenon 450 W doped-GQDs samples were investigated using light with excitation wavelength selected at 460 HR-TEM images at different magnifications. nm. The excitation-emission mapping (EEM) Fig. 1 are HR-TEM images of N-GQD measurement was carried out on Duetta synthesized samples from CA and urea. Fig. 1. HR-TEM images of N-GQDs sample synthesized from CA and urea These HR-TEM images show that GQD samples, on the PLE spectrum appears fabricating N-GQDs would result in doped- only 1 band with a maximum at 310 nm GQD fragments with near-uniform circular corresponding to C C * transition. For N- shape, narrow size distribution ranging from GQDs, the PLE spectrum shows that there are 10-20 nm when fabricated from CA and urea. two excitation bands at 310 nm and 370 nm, The lattice spacing of these N-GQDs has been which correspond to absorption transitions: C accurately measured to be 0.248 nm from the C * and C N *. Similarity interpretation HR-TEM image, which is comparable to what for S-GQDs. Photoluminescence excitation other authors have previously published [10]. spectra (PLE) show that the best wavelength for 3.2. Optical properties excitation of the S-GQD sample is 370 nm, while it is ~ 310 nm for the two GQD and Fig. 2 is the PL excitation spectra of GQD, N-GQD samples. N-GQDs, and S-GQDs samples. For undoped 32 L. X. Hung, T T. Hue, P. T. Nga / Tạp chí Khoa học và Công nghệ Đại học Duy Tân 02(45) (2021) 29-34 Fig. 2. PLE spectra of GQDs, N-GQDs, Fig. 3. PL spectra of GQDs, N-GQDs and S-GQDs and S-GQDs. samples under excitation at 370 nm. Fig. 3 is the PL spectra of GQD, N-GQDs, out Emission-Excitation mapping (EEM) on the and S-GQDs samples. We found that the PL Duetta (Horiba) system. The EEM images of intensity of S-GQD samples was very strong N-GQD and S-GQD samples are presented on compared to the luminescent intensity of GQD figure 4. These images show that for N-GQDs, and N-GQD samples. The reason here is that the emission maximum is located at the wavelength of 370 nm is not the appropriate approximately 425 nm with the most effective wavelength for excitation of GQD and N-GQD excitation wavelength at about 310 nm. For S- samples. Emission peaks are shifted towards GQD samples, the emission maximum is shorter wavelengths compared to N-GQDs. shifted towards longer wavelengths compared This can be explained as follows: doping S to N-GQD samples and is located at atoms into the GQD lattice causes the energy approximately 460 nm with effective excitation state to be at a higher-level position than wavelength in the range of 365-370 nm. It can doping N atoms into GQDs. be seen that the synthesized samples have In order to analyze in detail the fluorescent emission bands in the visible region, therefore properties of samples to get the big picture of they can be applied in bioimaging or other fluorescent spectra and excitation, we carried applications in medicine. Fig. 4. EEM images of N-GQDs (a) and S-GQDs (b) samples, measure from 300 nm to 700 nm under excitation wavelength from 250 nm to 500 nm. L. X. Hung, T T. Hue, P. T. Nga / Tạp chí Khoa học và Công nghệ Đại học Duy Tân 02(45) (2021) 29-34 33 The possible electron transitions responsible from transition between the same energy levels, for the photon emission could be as follows: leading to PL (3); the other is by vibration when the doped-GQDs are excited by a light at relaxation from C * n- * and n- * to = 310 nm, the photons are absorbed, resulting surface state transitions, then surface states in the electron transitions of C C *(1), n C recombination, producing PL (4,5) (see Fig. (C-N) C *(2). The excited electrons are 5). The resulting emission spectrum of deactivated via two mechanisms: one is by N-GQDs is a wide band, consisting of both direct recombination after vibration relaxation mechanisms above. Fig. 5. The possible PL emission mechanism for Fig. 6. The Raman spectra of N-GQD samples N-GQDs fabricated from two different carbon sources compared to non-doped GQDs. To identify the formation of graphene, experiments on the shift of G peak according to Raman spectra were used to observe the the nature of N-GQD samples is necessary. changes and effects produced by GQD Besides, we also observed a D' peak on the heteroatom doping. Fig. 6 is the Raman spectra Raman spectra of the two N-GQD samples due of N-GQD samples fabricated from two to the doping of N atoms into the GQD lattice. different carbon sources compared to non- 4. Conclusion doped GQDs. The D and G peaks of the non- doped bare GQD sample are observed at 1369.6 In summary, we have successfully fabricated N-GQD and S-GQD samples. However, the cm-1 and 1588 cm-1 on the Raman spectra, close to those values observed by other authors for fabrication method optimization is still a work N-GQDs [9, 10]. However, for N-doped in progress to find the optimal doping samples, we see that the D peak is shifted concentration of N or S atoms for the best towards shorter frequencies, while the G peak luminescence. Raman spectra were used to is shifted towards longer frequencies (for N- briefly evaluate the quality of synthesized N- GQDs fabricated from pyrene) or shorter, GQD samples. More detailed studies are still depending on each case. The position of the G being carried out. peak is also an indicator for the size, number of Acknowledgments layers, and amount of doped N in GQD This research is funded by NAFOSTED fragments. Therefore, more detailed under grants: number 103.03-2020.22. The 34 L. X. Hung, T T. Hue, P. T. Nga / Tạp chí Khoa học và Công nghệ Đại học Duy Tân 02(45) (2021) 29-34 authors thank Duy Tan University and the [6] F. Valentini, A. Calcaterra, V. Ruggiero, et al., Functionalized Graphene Derivatives: Antibacterial National Key Laboratory for Electronic Properties and Cytotoxicity, Journal of Materials and Devices of IMS for the use of Nanomaterials, 2019, 1-14. facilities. [7] H. Bian, Q. Wang, S. Yang, et al., Nitrogen-doped graphene quantum dots for 80% photoluminescence References quantum yield for inorganic γ-CsPbI3 perovskite solar cells with efficiency beyond 16%, Journal of [1] P. Tian, L. Tang, K.S. Teng, et al., Graphene Materials Chemistry A, 2019, 7 (10), 5740-5747. quantum dots from chemistry to applications, [8] H.Y. Nguyen, X.H. Le, N.T. Dao, et al., Microwave- Materials Today Chemistry, 2018, 10, 221-258. assisted synthesis of graphene quantum dots and [2] L.A. Ponomarenko, F. Schedin, M.I. Katsnelson, et nitrogen-doped graphene quantum dots: Raman al., Chaotic Dirac Billiard in Graphene Quantum characterization and their optical properties, Dots, Sci, 2008, 320 (5874), 356-358. Advances in Natural Sciences: Nanoscience and [3] Y. Zhao, C. Hu, Y. Hu, et al., AVersatile, Ultralight, Nanotechnology, 2019, 10 (2), 025005. Nitrogen-Doped Graphene Framework, Angew. [9] S. Kadian, G. Manik, K. Ashish, et al., Effect of sulfur Chem. Int. Ed., 2012, 51, 11371 –11375. doping on fluorescence and quantum yield of [4] N.T. Ngoc Anh, P.-Y. Chang, R.-A. Doong, Sulfur- graphene quantum dots: an experimental and doped graphene quantum dot-based paper sensor theoretical investigation, Nanotechnology, 2019, 30 for highly sensitive and selective detection of 4- (43), 435704. nitrophenol in contaminated water and wastewater, [10] R. Das, S. Parveen, A. Bora, et al., Origin of high RSC Advances, 2019, 9 (46), 26588-26597. photoluminescence yield and high SERS sensitivity [5] S. Kadian, G. Manik, A highly sensitive and selective of nitrogen-doped graphene quantum dots, Carbon, detection of picric acid using fluorescent sulfur- 2020, 160, 273-286. doped graphene quantum dots, Luminescence, 2020, 35 (5), 763-772.
File đính kèm:
 tinh_chat_quang_cua_cac_cham_luong_tu_graphene_pha_tap_nito.pdf

