Thực trạng thu hút đầu tư vào các khu công nghiệp ở tỉnh Thừa Thiên Huế
Nghiên cứu này được thực hiện nhằm phân tích thực trạng thu hút đầu tư vào các khu công
nghiệp (KCN) ở trên địa bàn tỉnh Thừa Thiên Huế thông qua sử dụng phương pháp thống kê mô
tả với số liệu, thông tin thứ cấp được thu thập từ các cơ quan liên quan ở địa phương. Kết quả
nghiên cứu cho thấy, số lượng các dự án được cấp mới giấy chứng nhận đầu tư vào các KCN ở
trên địa bàn tỉnh Thừa Thiên Huế tăng hàng năm và lũy kế vốn đầu tư thực hiện các dự án liên
tục tăng trong những năm gần đây. Tuy nhiên, những điểm yếu về cơ sở hạ tầng KCN và chất
lượng nguồn nhân lực thấp vẫn là những rào cản trong thu hút đầu tư vào các KCN. Để thu hút
đầu tư vào các khu công nghiệp trong thời gian tới, chính quyền địa phương cần ưu tiên đầu tư
vào cơ sở hạ tầng khu công nghiệp (đặc biệt là các nhà máy xử lý nước thải), thực hiện các ưu
đãi cho các dự án công nghệ cao và cải thiện chất lượng dịch vụ công.
Trang 1
Trang 2
Trang 3
Trang 4
Trang 5
Trang 6
Trang 7
Trang 8
Trang 9
Trang 10
Tải về để xem bản đầy đủ
Tóm tắt nội dung tài liệu: Thực trạng thu hút đầu tư vào các khu công nghiệp ở tỉnh Thừa Thiên Huế
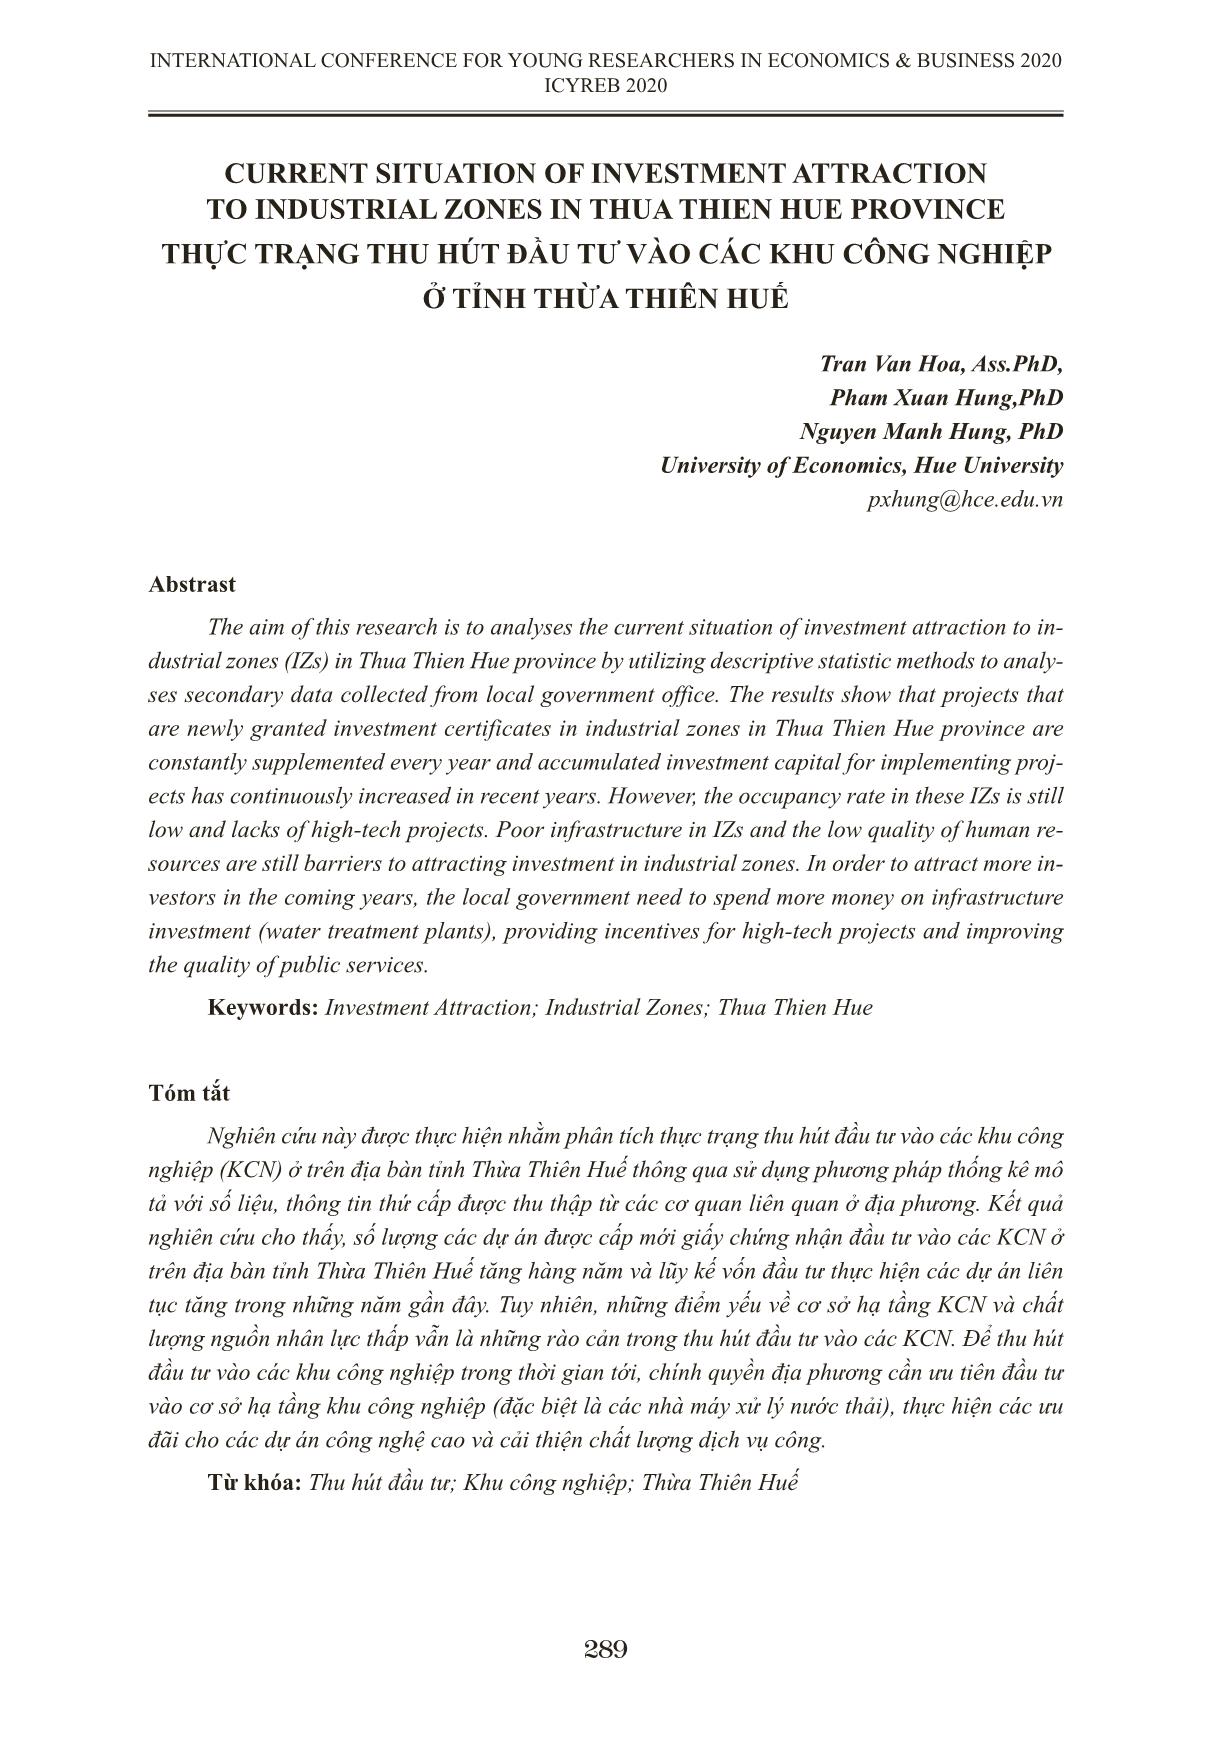
CURRENT SITUATION OF INVESTMENT ATTRACTION
TO INDUSTRIAL ZONES IN THUA THIEN HUE PROVINCE
THỰC TRẠNG THU HÚT ĐẦU TƯ VÀO CÁC KHU CÔNG NGHIỆP
Ở TỈNH THỪA THIÊN HUẾ
Tran Van Hoa, Ass.PhD,
Pham Xuan Hung,PhD
Nguyen Manh Hung, PhD
University of Economics, Hue University
pxhung@hce.edu.vn
Abstrast
The aim of this research is to analyses the current situation of investment attraction to in-
dustrial zones (IZs) in Thua Thien Hue province by utilizing descriptive statistic methods to analy-
ses secondary data collected from local government office. The results show that projects that
are newly granted investment certificates in industrial zones in Thua Thien Hue province are
constantly supplemented every year and accumulated investment capital for implementing proj-
ects has continuously increased in recent years. However, the occupancy rate in these IZs is still
low and lacks of high-tech projects. Poor infrastructure in IZs and the low quality of human re-
sources are still barriers to attracting investment in industrial zones. In order to attract more in-
vestors in the coming years, the local government need to spend more money on infrastructure
investment (water treatment plants), providing incentives for high-tech projects and improving
the quality of public services.
Keywords: Investment Attraction; Industrial Zones; Thua Thien Hue
Tóm tắt
Nghiên cứu này được thực hiện nhằm phân tích thực trạng thu hút đầu tư vào các khu công
nghiệp (KCN) ở trên địa bàn tỉnh Thừa Thiên Huế thông qua sử dụng phương pháp thống kê mô
tả với số liệu, thông tin thứ cấp được thu thập từ các cơ quan liên quan ở địa phương. Kết quả
nghiên cứu cho thấy, số lượng các dự án được cấp mới giấy chứng nhận đầu tư vào các KCN ở
trên địa bàn tỉnh Thừa Thiên Huế tăng hàng năm và lũy kế vốn đầu tư thực hiện các dự án liên
tục tăng trong những năm gần đây. Tuy nhiên, những điểm yếu về cơ sở hạ tầng KCN và chất
lượng nguồn nhân lực thấp vẫn là những rào cản trong thu hút đầu tư vào các KCN. Để thu hút
đầu tư vào các khu công nghiệp trong thời gian tới, chính quyền địa phương cần ưu tiên đầu tư
vào cơ sở hạ tầng khu công nghiệp (đặc biệt là các nhà máy xử lý nước thải), thực hiện các ưu
đãi cho các dự án công nghệ cao và cải thiện chất lượng dịch vụ công.
Từ khóa: Thu hút đầu tư; Khu công nghiệp; Thừa Thiên Huế
289
INTERNATIONAL CONFERENCE FOR YOUNG RESEARCHERS IN ECONOMICS & BUSINESS 2020
ICYREB 2020
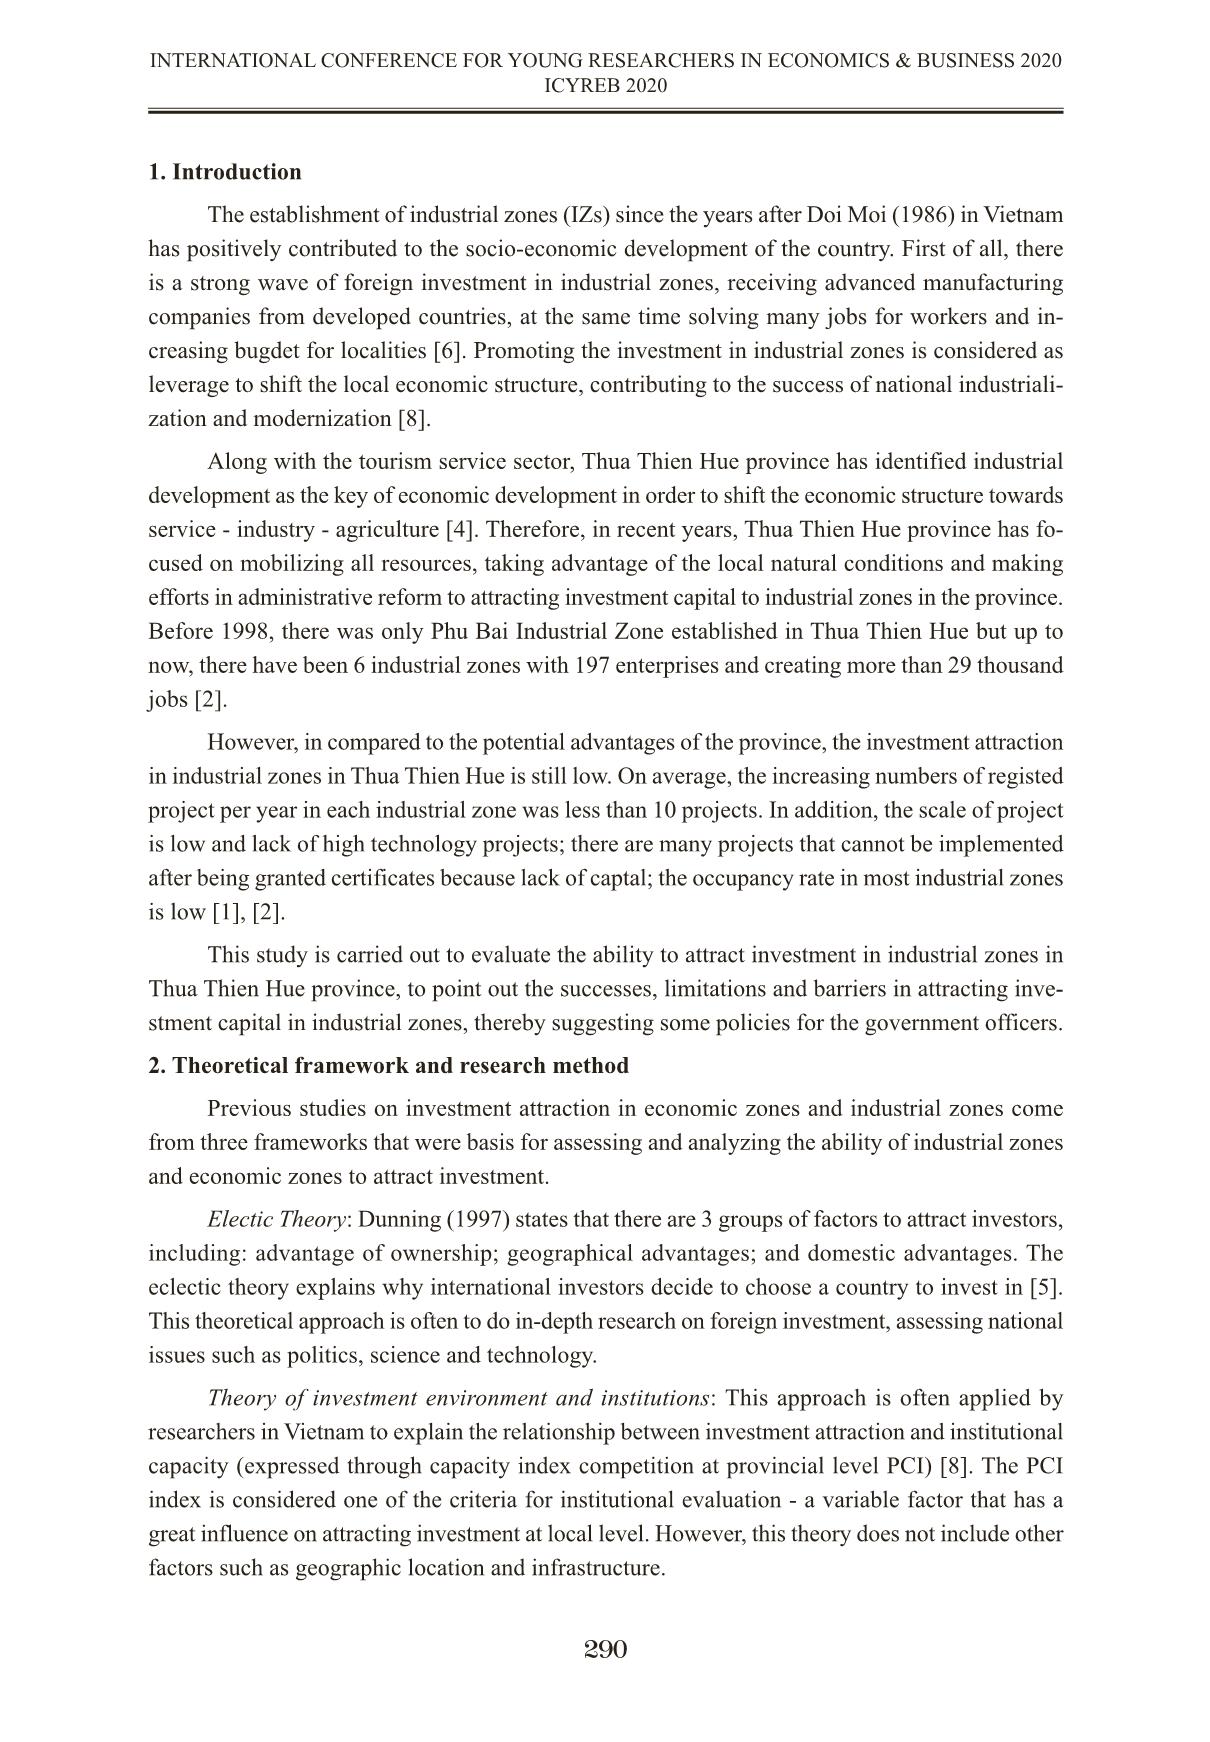
1. Introduction
The establishment of industrial zones (IZs) since the years after Doi Moi (1986) in Vietnam
has positively contributed to the socio-economic development of the country. First of all, there
is a strong wave of foreign investment in industrial zones, receiving advanced manufacturing
companies from developed countries, at the same time solving many jobs for workers and in-
creasing bugdet for localities [6]. Promoting the investment in industrial zones is considered as
leverage to shift the local economic structure, contributing to the success of national industriali-
zation and modernization [8].
Along with the tourism service sector, Thua Thien Hue province has identified industrial
development as the key of economic development in order to shift the economic structure towards
service - industry - agriculture [4]. Therefore, in recent years, Thua Thien Hue province has fo-
cused on mobilizing all resources, taking advantage of the local natural conditions and making
efforts in administrative reform to attracting investment capital to industrial zones in the province.
Before 1998, there was only Phu Bai Industrial Zone established in Thua Thien Hue but up to
now, there have been 6 industrial zones with 197 enterprises and creating more than 29 thousand
jobs [2].
However, in compared to the potential advantages of the province, the investment attraction
in industrial zones in Thua Thien Hue is still low. On average, the increasing numbers of registed
project per year in each industrial zone was less than 10 projects. In addition, the scale of project
is low and lack of high technology projects; there are many projects that cannot be implemented
after being granted certificates because lack of captal; the occupancy rate in most industrial zones
is low [1], [2].
This study is carried out to evaluate the ability to attract investment in industrial zones in
Thua Thien Hue province, to point out the successes, limitations and barriers in attracting inve-
stment capital in industrial zones, thereby suggesting some policies for the government officers.
2. Theoretical framework and research method
Previous studies on investment attraction in economic zones and industrial zones come
from three frameworks that were basis for assessing and analyzing the ability of industrial zones
and economic zones to attract investment.
Electic Theory: Dunning (1997) states that there are 3 groups of factors to attract investors,
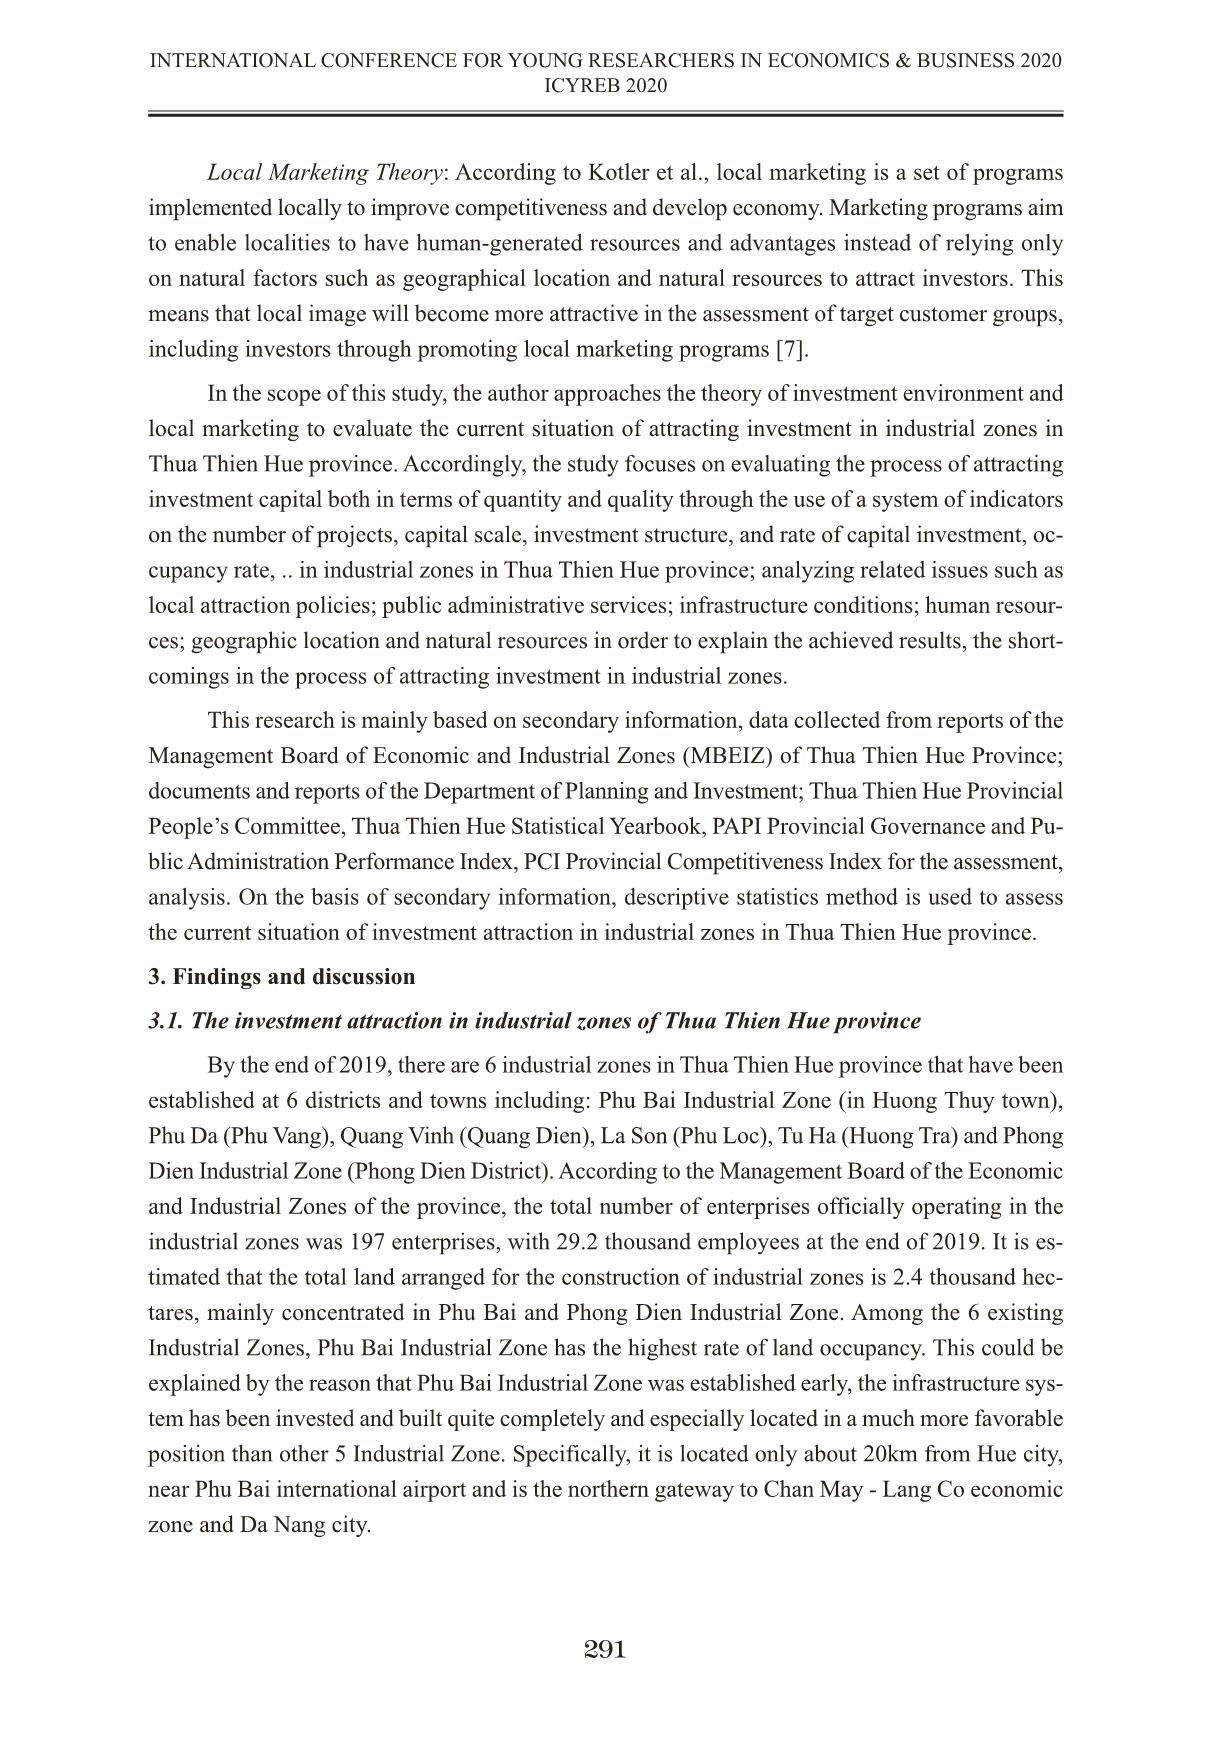
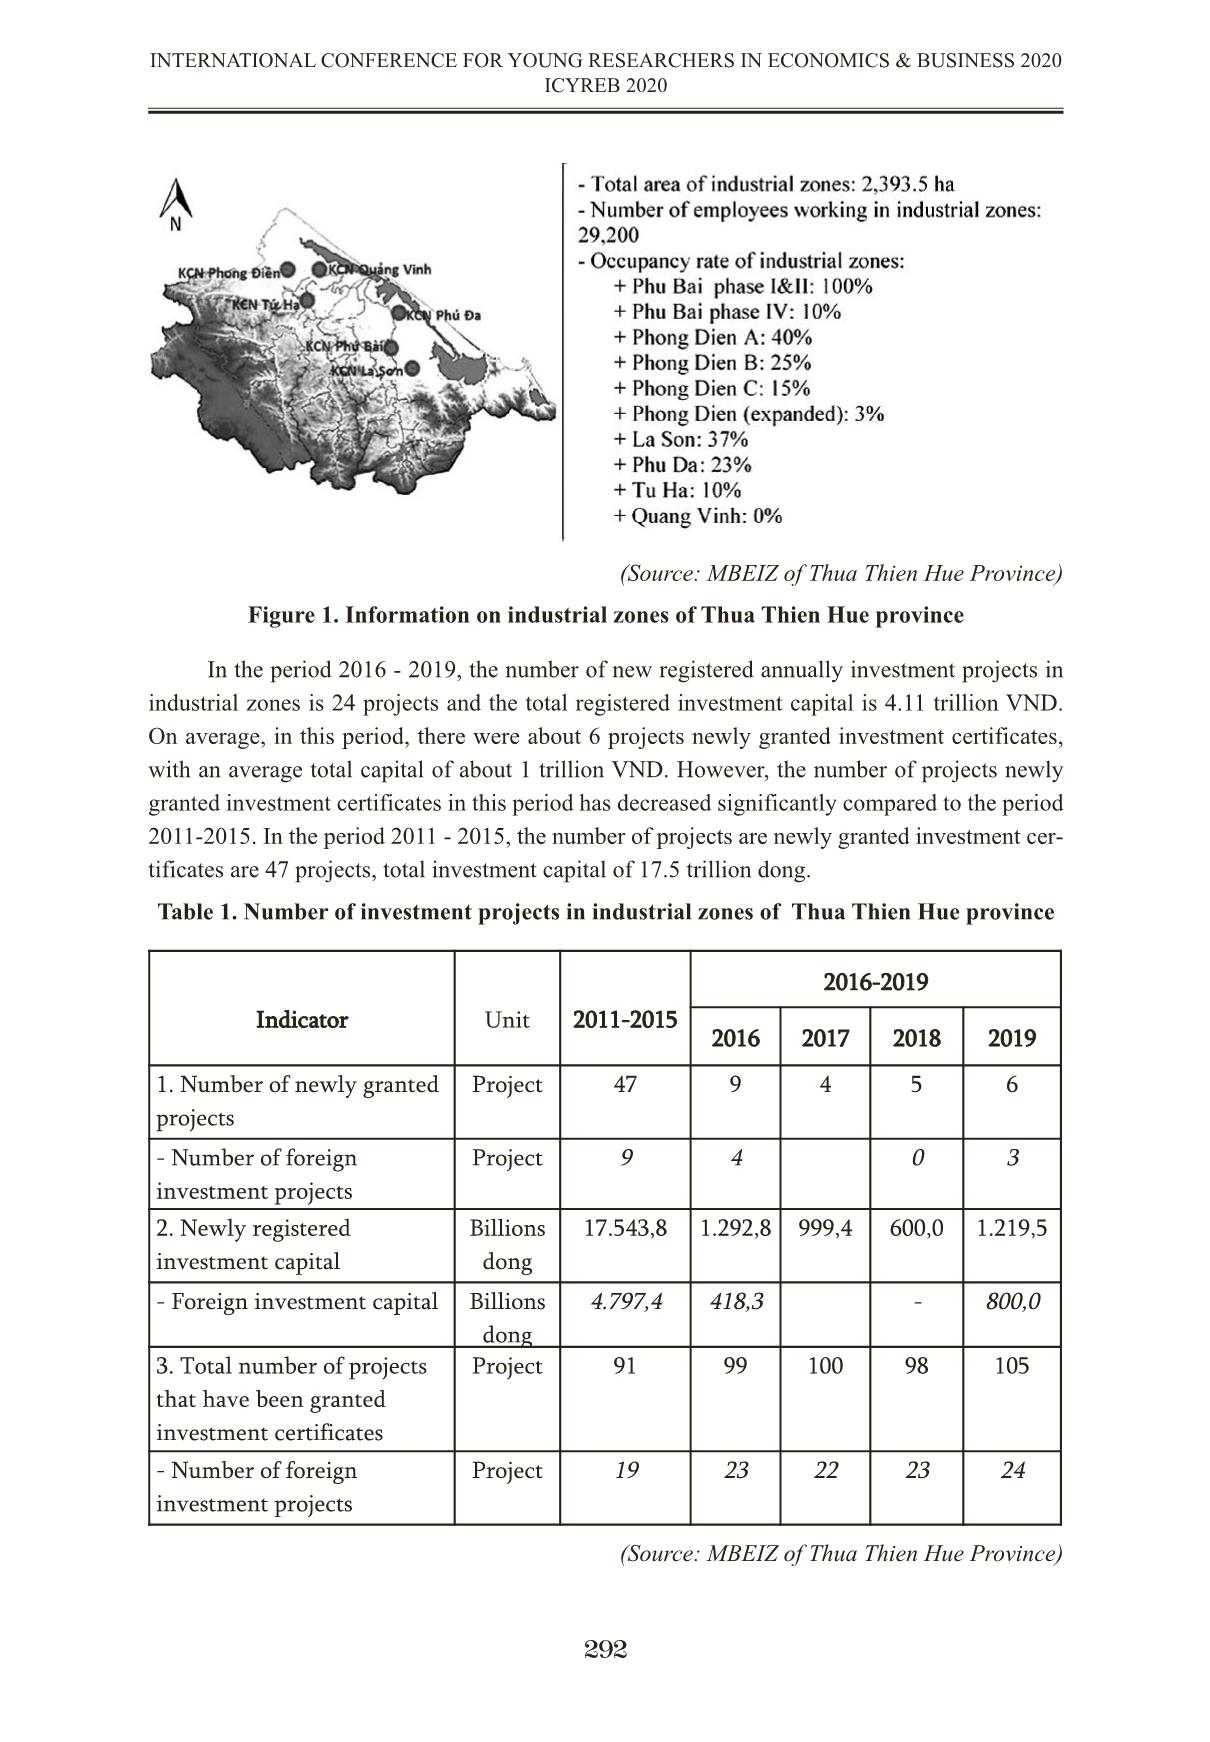
including: advantage of ownership; geographical advantages; a ... ent (SAFTA). Othineo and Shinyek (2001) evaluated the role of African community customs
unions on trade, total revenue and welfare of Uganda. Llano, Perez and Hengwings (2019) used
SMART to evaluate the impact of 10%-25% of alumni tariff import of US on Spanish regions,
the result showed that US import tariff might create 185.000 job loss world-wide and 3.500 job
loss in Spain. Veeramani, Saini (2011) incorporated both SMART and gravity model to find out
the impact of ASEAN – India FTA on export of plantation products which include coffee, tea
and pepper in India. However, sectoral level studies on Vietnam FTA impact using SMART are
rather limited in quantity. Vu (2016) found a significant positive impact of EVFTA on Vietnam
medical export, specifically in the pharmaceutical sector. Anh and Ngoc (2011) used SMART to
analyze the impact of RCEP on Vietnam’s automobile import. Nga, Minh, Dat (2020) aimed at
analyzing the impact of EVFTA on Vietnam automobile’s export.
The above review of existing literatures on the topic of FTAs influences reveals the limited
quantity in research dedicated to quantifying the impact of new-generation FTAs such as EVFTA
and CPTPP on products - level trade flow. As a result, this paper aims at analyzing the impact of
EVFTA on Vietnam seafood export at HS-4 digits level.
3. Research methodology
3.1. Partial Equilibrium theory (PE)
Partial equilibrium theory stemmed from basic supply and demand principle of economics
and its name contribute to the fact that PE only consider effect on a single industry under certain
policy changes and often neglect the spill-over effect on the whole economy. A basic theory
framework for PE model is presented below.
An import country j’s demand function toward good i from exporter k, will take the fol-
lowing form
301
INTERNATIONAL CONFERENCE FOR YOUNG RESEARCHERS IN ECONOMICS & BUSINESS 2020
ICYREB 2020
Mi = αMPM
ε
With αM is the demand constant and ε is the demand elasticity (import elasticity in this
case) which then take up the following characteristic ε < 0. M is the total demand for product i
at the import price of PM. Similarly, a supply function will take the following form
Xi = αXPX
η
With αX is the supply constant and η > 0 is the supply elasticity, which is often assume
to be close to positive infinity if the importer is considered to be small or has negligible import
volume compared to global production. This assumption essentially means the market demand
is constantly fulfilled by suppliers. The equilibrium condition of industry for goods i is pre-
sented as
Mi = Xi
The relationship between import and export price is essentially characterize by the addition
of tariff which can be illustrated through the following function
PM = PX(1 + T/100)
With T is understood as the level of tariff in percentage. The welfare effect derived from
the changes in price can be calculated as integral of the supply and demand function
These expressions complete the basic foundation of a PE model which can be used to sim-
ulate the impact of alteration in tariff policies to trade volume of a single industry.
3.2. Single Market Partial Equilibrium Tool (SMART)
SMART is a simulation tool developed by World Integrated Trade Solution (WITS) – WTO
to utilize PE model to simulate a “what if” or counter-factual scenario of tariff related policies
based on data of a given year. SMART will calculate the counter-factual trade volume through 2
steps. Firstly, with the given information on supply and demand elasticities as well as the total
price changes due to tariff, SMART will calibrate the total demand volume of good i. Afterwards,
SMART will utilize data on products substitution elasticity (Armington elasticity) to calculate
demand for each varieties of the products. As based mostly on the theory of PE, SMART will
only give result on changes in one industry as it exists independently from the whole economy.
In order to implement SMART, the following counter factual scenario is constructed:
The EU eliminates import tariff on fisheries products of Vietnam from 2018 to 2028. The
trade data used for the counter-factual scenario (base year) is 2018
4. Data
Seafood trade data between EU members and partner is extracted from UNCOMTRADE
and the existing tariff from TRAINS data base (tariff rates are counted as MFN). These data have
already been incorporated in SMART derived from WITS software. Trade value is considered
on HS – 4 digits level.
302
INTERNATIONAL CONFERENCE FOR YOUNG RESEARCHERS IN ECONOMICS & BUSINESS 2020
ICYREB 2020
The next section will provide a preliminary analysis on data of sea food trade between
Vietnam and EU in the base year of 2018.
(Unit: 000’ USD)
(Source: UNCOMTRADE)
Figure 4.1: Volume of seafood trade of major exporter to EU region
According to seafood trade data in 2018 extracted from UNCOMTRADE, Vietnam ranked
fifth in total export volume into the EU which was at 1.775.080 thousand USD. However, Vietnam
seafood export to EU destinations was relatively equal compared to others major exporters (China
at 1841654 thousand USD, Iceland at 2259506 thousand USD and United States at 1841654 thou-
sand USD). The only exception is Norway with distinct trade volume which is at 18691052 thou-
sand USD in 2018, this outlier can partly be explained by the close proximity between Norway
and other members of the EU. Furthermore, the exceptional trade volume of Norway can also be
explained by the similarity in taste and demand within the region. Nevertheless, the figures rep-
resent the importance of Vietnam’s export of fishery products to the EU regions as well as the
opportunities that Vietnam potentially obtained under the influence of EVFTA.
(Unit: 000’ USD)
Figure 4.2: Volume of Vietnam’s HS-4 digits level seafood export to the EU
(Source: UNCOMTRADE)
303
INTERNATIONAL CONFERENCE FOR YOUNG RESEARCHERS IN ECONOMICS & BUSINESS 2020
ICYREB 2020
Considering data on Vietnam seafood export to the EU on HS-4 digits level, the majority
of commercial activities in seafood products between Vietnam and EU concentrates in HS 0306
(Crustaceans) and HS 0304 (Fish fillets and other fish meat) which were at approximately 480000
thousand USD and 349856 thousand USD respectively in 2018. This reflects Vietnam’s seafood
export structure which is heavily comprise of shrimps (included in HS 0306) and tuna, catfish
(included in HS 0304). Other HS codes experience significant lower export volume, while HS
0303 (Frozen fish) enjoyed moderate trade at 44702 thousand USD, other HS codes including
0308 (Frozen fish), 0307 (Molluscs), 0305 (Fish, dried, salted or in brine; smoked fish), 0302
(Fish; fresh or chilled, 0301 (Live fish) had negligible trade flow, averaging around 2500 thousand
USD in 2018.
5. Simulation Results
5.1. Impact of EVFTA on total seafood export of Vietnam
Overall, simulation result presents a positive prospect for Vietnam export under the influ-
ence of EVFTA. SMART’s result on changes in Vietnam’ export trade is presented below
Table 5.1: Simulation result on impact of EVFTA on Vietnam’s
total seafood export volume
(Unit: 000’ USD)
(Source: authors’ calculation)
According to SMART result, tariff abolishment agreed by EVFTA will boost Vietnam’s
sea food export to EU region by 2 million USD, which is an increase of 18.2%. In relation to the
substantial export volume of Vietnam to the EU and the relatively high tariff barriers that Viet-
nam’s seafood products have to face, this addition trade value of 18.2% is relatively small com-
pared to expected growth of other SMART research dedicated to EVFTA impact on Vietnam
trade volume. Specifically, Minh (2019) suggested that under the influence of EVFTA Vietnam
import of meat products is expected to increase exponentially, some codes even enjoy a 600%
growth or Huong (2018) suggests a 90-100 percent growth in pharmacutical prodducts’s export
under the influence of EVFTA. Therefore, an increase of 18.2% in seafood products can be con-
sidered relatively small. This restricted growth can be explained by Vietnam’s concentrated export
structure into the EU. Vietnam’s main seafood export products (HS 0304, 0306, 0303) reflects
demand of EU domestic users. Therefore, the 0% preference tariff of EVFTA will help boosting
trade between Vietnam and EU under these products, however, domestic EU users have limited
demand for Vietnam’s seafood variety which will act as a restriction to Vietnam’s export growth.
Furthermore, the growth of Vietnam’s seafood export influenced by EVFTA might be underesti-
mate due to SMART calculation characteristic. SMART pure calculation framework based on
304
INTERNATIONAL CONFERENCE FOR YOUNG RESEARCHERS IN ECONOMICS & BUSINESS 2020
ICYREB 2020
Index Value
Export value before EVFTA 887540
Export value after EVFTA 1049740
Net value change 162199
Percentage value change 18.2%
demand and supply theory, preventing it from taking into account changes in taste of taste of im-
porter as well as manufactural technology of exporter which might downward bias the simulation
results.
5.2. Impact of EVFTA on Vietnam’s seafood export at products level
Table 5.2 presents results on products level (HS-4) export growth of Vietnam as tariff re-
duced to 0%, a more detail results at HS-6 digits level will be presented in the Appendix for read-
ers interested in finding disaggregated results. An asymmetric of growth distribution can be clearly
identified from the SMART result. Considering net value of export growth, HS code 0303 rank
first with approximately 99649 thousand USD in net value change, follow by HS code 0306 and
Hs code 0304 with 31621 and 25565 thousand USD respectively. Unsurprisingly, growth of prod-
ucts is in proportion with trade values, hence HS lines with already substantial trade flow will
gains more benefits from liberalization of tariff. However, an exception is HS 0303 which has
moderate trade value before EVFTA but outstanding growth after EVFTA, this can be explained
by the high tariff barrier imposing on products within HS 0303. Apart from the aforementioned
HS codes, others witness negligible absolute growth due to limited trade flow, again these growth
rate can be underestimated as the result of SMART calculation nature.
Regarding real growth rate (percentage change), heterogeneity in growth rate can again be
observed, HS code 0303 gains distinct growth rate at 222%. While HS 0305 and HS 0302 average
around 63% in growth rate. However, despite having exception net value change, HS 0306, 0304
have relatively restricted real growth at around 6.6% which is similar to others HS code 0307
(5%) and 0308 (6.6%). HS code 0301 has negligible changes in export value at 1.8%.
Table 5.2: Vietnam seafood export changes at HS-4digits level
(Unit: ‘000 USD)
(Source: authors’ calculation)
6. Recommendations for promoting Vietnam’s trade benefits under EVFTA
Results extracted from SMART suggest positive outcomes for Vietnam’s seafood export
to EU members as tariff regress to 0% under the commitment of EVFTA. However, growth rate
305
INTERNATIONAL CONFERENCE FOR YOUNG RESEARCHERS IN ECONOMICS & BUSINESS 2020
ICYREB 2020
HS code Export before
EVFTA
Export after
EVFTA
Net changes in ex-
port value
Percentage changes
in export value
0308 1033.44 1101.30 67.86 6.6%
0307 1145.38 1202.57 57.19 5.0%
0306 479990.65 511612.10 31621.45 6.6%
0305 8206.32 13272.66 5066.34 61.7%
0304 349856.47 375421.55 25565.08 7.3%
0303 44702.48 144351.55 99649.07 222.9%
0302 197.26 326.84 129.58 65.7%
0301 2408.13 2451.04 42.91 1.8%
expected is of moderate level despite Vietnam’s substantial export volume into the EU. Therefore,
it is important that Vietnam government and businesses adopt certain strategy to better utilize
preference tariff level of EVFTA.
- Recommendations for Vietnam government
Firstly, Vietnam government should provide businessess with support and funding to pro-
mote R&D activities in order to improve quality of export products to better adapt to EU demand.
Furthermore, the government can promote trade faciliation to reduce export cost for Vietnam
businesses.
Secondly, Vietnam government should create a stable environment to promote domestic
productivity of seafood, as well as provide firms will opportunity to diversify their commodity.
Thirdly, A range of export promotion programs and funding should be established in order
to aid businesses in market penetration activities. This solution should help Vietnam’ businesses
in competing with other major seafood exporters such as United State, China or even Norway.
Recommendations for Vietnam’s businesses
Firstly, Vietnam businesses should be active in diversify their products to satisfy EU’s de-
mand and taste. Vietnam’s businesses should also seek to expand trade products to other potential
HS codes such as 0302 or 0301.
Secondly, Vietnam businesses should improve international competitiveness by investing
in modern production process and methods of products conservation during transportation in
order to enhance exports quality.
7. Conclusion
This paper contributes to the number of ex-ante research dedicated to new generation FTA
impact on countries by utilizing SMART embedded with PE theory to quantify the potential in-
fluence of EVFTA on Vietnam seafood export volume.
The results suggest an unsurprising improvement in already substantial Vietnam seafood
export flow into EU destinations. However, growth rate derived from SMART is small in relation
to the size of tariff abolished as well as Vietnam’s export share in EU market (ranked 5th in 2018).
This is believed to be the reflection of Vietnam’s seafood export structure to the EU concentrating
on certain HS codes (0304, 0306) which already enjoy relative low tariff rate prior to EVFTA.
However, it is worth to mention the potential downward bias that underestimate growth rate result
stemmed from the calculation nature of SMART as the tool underlying theory doesn’t allow ex-
tensive margin estimation (calculate how changes in trade policy diversify export basket).
Furthermore, analysis regarding export flow on disaggregated data, specifically HS-4 digits
products, show an uneven distribution of net as well as real growth rate among different products
code. Product lines with higher trade flow obtain higher net growth as a result of tariff reduction,
however, real growth rate (calculate as the percentage difference between trade flow prior and
after EVFTA) is not expected to concentrate on these products.
Based on SMART results, certain recommendations for Vietnam’s government and busi-
nesses are also drawn out aiming at extending the advantages of Vietnam exports from EFVFTA
commitments.
306
INTERNATIONAL CONFERENCE FOR YOUNG RESEARCHERS IN ECONOMICS & BUSINESS 2020
ICYREB 2020
File đính kèm:
 thuc_trang_thu_hut_dau_tu_vao_cac_khu_cong_nghiep_o_tinh_thu.pdf

