Sự xuất hiện của hợp đồng tương lai chỉ số và sự biến động của thị trường: Nghiên cứu thực nghiệm tại Việt Nam
From the first trading in 2000, Vietnam stock market has witnessed spectacular growth. In
2017, with the first index futures contract, Vietnam has become the fifth country in ASEAN (after
Singapore, Indonesia, Malaysia and Thailand) which has derivatives market. Since then, derivatives market has drawn enormous attention from investors. For 3 years since the introduction of
VN30 index futures, by the end of July 2020, 67.9 million futures contracts were traded. Vietnam
derivatives market is particularly active when the underlying market is strongly volatile. The liquidity in derivatives market continuously surpassed the previous levels. In 2019, average trading
volume on the derivatives market reached 88,740 contracts per session, increase by 12.6% compared to previous year.
VN30 index futures contract, though having attracted many investors, raises the concernof increasing volatility in the spot market. Wang, Lin, Lin & Lai (2020) has pointed out that index
futures become one of the mose popular speculative instruments nowadays. Bologna and Cavallo
(2002) state that futures market promotes speculation which leads to increasing volatility in the
underlying spot market. However, another group of literature argues that the futures market contributes to price discovery process, hence it has positive effect on underlying market. As the index
futures become more widespread coupled with upcoming derivatives instrument in Vietnam market, the investigation of futures trading on stock market volatility is essential.
Trang 1
Trang 2
Trang 3
Trang 4
Trang 5
Trang 6
Trang 7
Trang 8
Trang 9
Trang 10
Tải về để xem bản đầy đủ
Tóm tắt nội dung tài liệu: Sự xuất hiện của hợp đồng tương lai chỉ số và sự biến động của thị trường: Nghiên cứu thực nghiệm tại Việt Nam
INDEX FUTURES INTRODUCTION AND STOCK MARKET
VOLATILITY: EMPIRICAL STUDY IN VIETNAM
SỰ XUẤT HIỆN CỦA HỢP ĐỒNG TƯƠNG LAI CHỈ SỐ
VÀ SỰ BIẾN ĐỘNG CỦA THỊ TRƯỜNG: NGHIÊN CỨU
THỰC NGHIỆM TẠI VIỆT NAM
MA, Nguyen Ngoc Tram
National Economics University
tramnn@neu.edu.vn
Abstract:
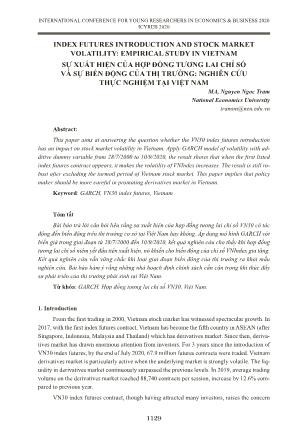
This paper aims at answering the question whether the VN30 index futures introduction
has an impact on stock market volatility in Vietnam. Apply GARCH model of volatility with ad-
ditive dummy variable from 28/7/2000 to 10/9/2020, the result shows that when the first listed
index futures contract appears, it makes the volatility of VNIndex increases. The result is still ro-
bust after excluding the turmoil period of Vietnam stock market. This paper implies that policy
maker should be more careful in promoting derivatives market in Vietnam.
Keyword: GARCH, VN30 index futures, Vietnam
Tóm tắt
Bài báo trả lời câu hỏi liệu rằng sự xuất hiện của hợp đồng tương lai chỉ số VN30 có tác
động đến biến động trên thị trường cơ sở tại Việt Nam hay không. Áp dụng mô hình GARCH với
biến giả trong giai đoạn từ 28/7/2000 đến 10/9/2020, kết quả nghiên cứu cho thấy khi hợp đồng
tương lai chỉ số niêm yết đầu tiên xuất hiện, nó khiến cho biến động của chỉ số VNIndex gia tăng.
Kết quả nghiên cứu vẫn vững chắc khi loại giai đoạn biến động của thị trường ra khỏi mẫu
nghiên cứu. Bài báo hàm ý rằng những nhà hoạch định chính sách cần cận trọng khi thúc đẩy
sự phát triển của thị trường phái sinh tại Việt Nam.
Từ khóa: GARCH, Hợp đồng tương lai chỉ số VN30, Việt Nam.
1. Introduction
From the first trading in 2000, Vietnam stock market has witnessed spectacular growth. In
2017, with the first index futures contract, Vietnam has become the fifth country in ASEAN (after
Singapore, Indonesia, Malaysia and Thailand) which has derivatives market. Since then, deriva-
tives market has drawn enormous attention from investors. For 3 years since the introduction of
VN30 index futures, by the end of July 2020, 67.9 million futures contracts were traded. Vietnam
derivatives market is particularly active when the underlying market is strongly volatile. The liq-
uidity in derivatives market continuously surpassed the previous levels. In 2019, average trading
volume on the derivatives market reached 88,740 contracts per session, increase by 12.6% com-
pared to previous year.
VN30 index futures contract, though having attracted many investors, raises the concern
1129
INTERNATIONAL CONFERENCE FOR YOUNG RESEARCHERS IN ECONOMICS & BUSINESS 2020
ICYREB 2020
of increasing volatility in the spot market. Wang, Lin, Lin & Lai (2020) has pointed out that index
futures become one of the mose popular speculative instruments nowadays. Bologna and Cavallo
(2002) state that futures market promotes speculation which leads to increasing volatility in the
underlying spot market. However, another group of literature argues that the futures market con-
tributes to price discovery process, hence it has positive effect on underlying market. As the index
futures become more widespread coupled with upcoming derivatives instrument in Vietnam mar-
ket, the investigation of futures trading on stock market volatility is essential.
This paper investigates the impact of VN30 index futures introduction on Vietnam stock
market volatility (representing by VNIndex volatility). Specifically, this paper first examines
whether there is any difference in volatility before and after the trading of VN30 index futures.
Then this paper tests whether the introduction of futures contract has an negative or positive in-
fluence on the stock market volatility. In this empirical analysis, this paper applies Generalized
Autoregressive Conditional Heteroskedasticity (GARCH) to model volatility. Most of previous
literature have been conducted in developed market (USA, UK, etc.) while a small number of
studies relates to other countries. This is the first paper to examine this matter in Vietnam.
The paper structure is as follows: section 2 presents brief review of previous literature, sec-
tion 3 describes data collection and methodology, section 4 presents results, section 5 provides
discussion and conclusion on this study.
2. Literature review
There are two main strands in the theoretical researches debating about the impact of futures
on the spot market.
One strand of literature argues that index futures introduction has negative influence on
the spot market. Stein (1987) states that futures market has high degree of leverage, therefore, it
attracts many uninformed traders. Such traders create noises in the market (Black, 2001), which
make information level of futures traders lower compared to cash market traders, then increases
the market volatility. Cox (1976), Finglewski (1981), Stein (1987), Cagan (1981) and Harris
(1989) agree with this argument.
Another strand in the literature supports the argurments of futures trading benefits including
price discover ...  daily returns. All data
are retrieved from the website  Data is processed using R software. For
GARCH modelling, this paper uses R code provided by Perlin, Mastella, Vancin and Ramos
(2020).
This paper uses continuous compounded rate of return as dependent variable in the mean
model. Specifically, the rate of return is calculated as the difference of natural logarithm of two
consecutive spot index prices.
To examine whether volatility in the underlying market has changed after the futures in-
troduction, this paper applies ARCH family of models. According to Engle (1982), the ARCH
process gives the explanation of difference between conditional and unconditional variance.
ARCH model allows the conditional variance to be time-varying while unconditional variance
remains constant. ARCH (q) model is as follows:
1131
INTERNATIONAL CONFERENCE FOR YOUNG RESEARCHERS IN ECONOMICS & BUSINESS 2020
ICYREB 2020
Where , Xt is a vector including the information set , is error term, is the conditional
volatility. Bollerslev (1986), student of Engle, suggests a generalized ARCH, which is called
GARCH. In the GARCH (p,q) model, the conditional variance is specified as:
GARCH model restricted that , and . provide information about the extent to which past
returns can be used to explained current volatility. The sum (a+c) captures the volatility persist-
ence and is restricted to be smaller than 1. If (a+c) > 1, the volatility is explosive. It means that
a shock in volatility leads to even larger shock in the next period. Hồ Thủy Tiên et al (2017),
Phạm Chí Khoa (2017), and Lê Văn Tuấn & Phùng Duy Quang (2020) find evidence that GARCH
(1,1) is suitable to explain stock market volatility in Vietnamese market. In this paper, I will use
the same approach in Vietnam context.
To explore the structural break in volatilty in Vietnam stock market when VN30 futures is
introduced, dummy variable is added to the GARCH (1,1) model:
DUM is represented for dummy variable which takes value of 0 in the period of no index
futures trading and value of 1 in the period of index futures trading. If the coefficient of DUM is
significantly different from 0, the VN30 index futures introduction has influenced the stock mar-
ket. Moreover, the sign of DUM’s coefficient let us know whether this impact is positive or neg-
ative. The flow of this empirical analysis is summarized as follows:
1132
INTERNATIONAL CONFERENCE FOR YOUNG RESEARCHERS IN ECONOMICS & BUSINESS 2020
ICYREB 2020
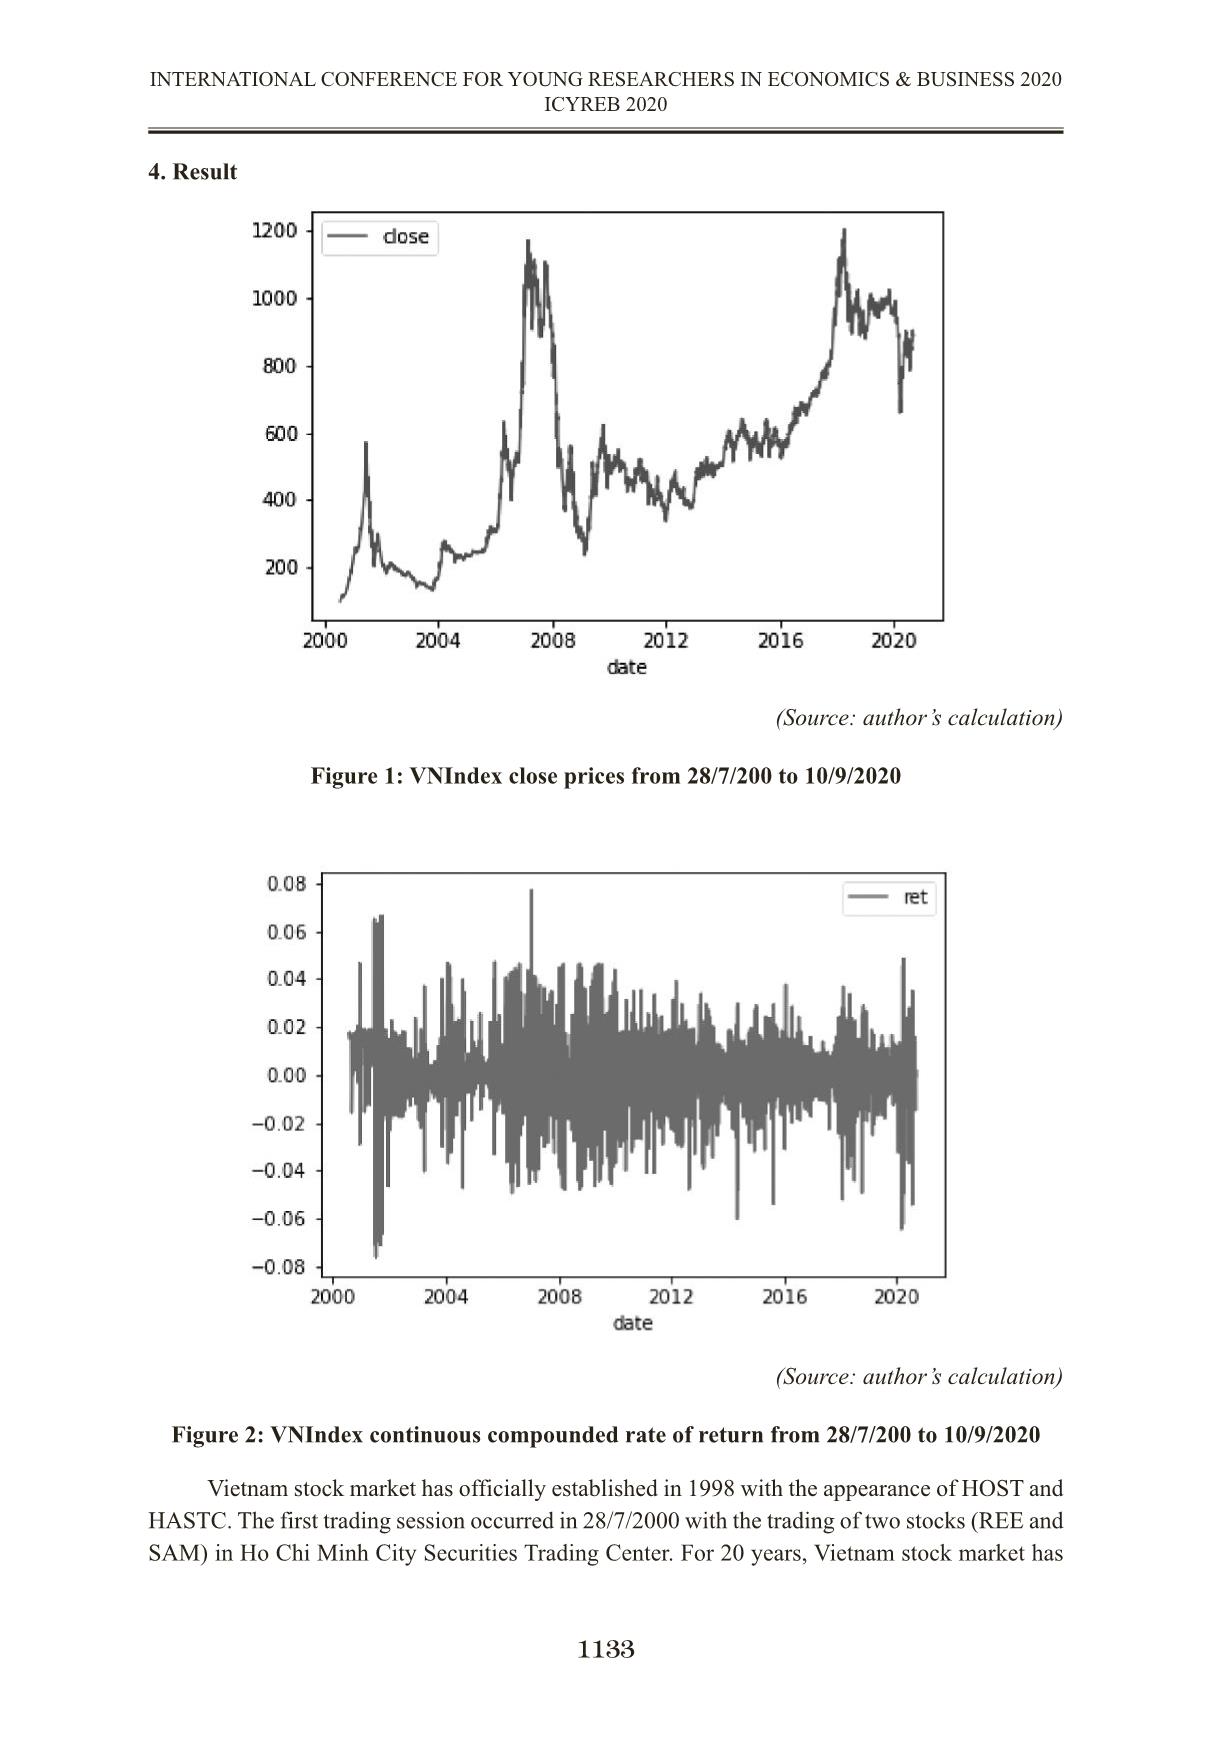
4. Result
(Source: author’s calculation)
Figure 1: VNIndex close prices from 28/7/200 to 10/9/2020
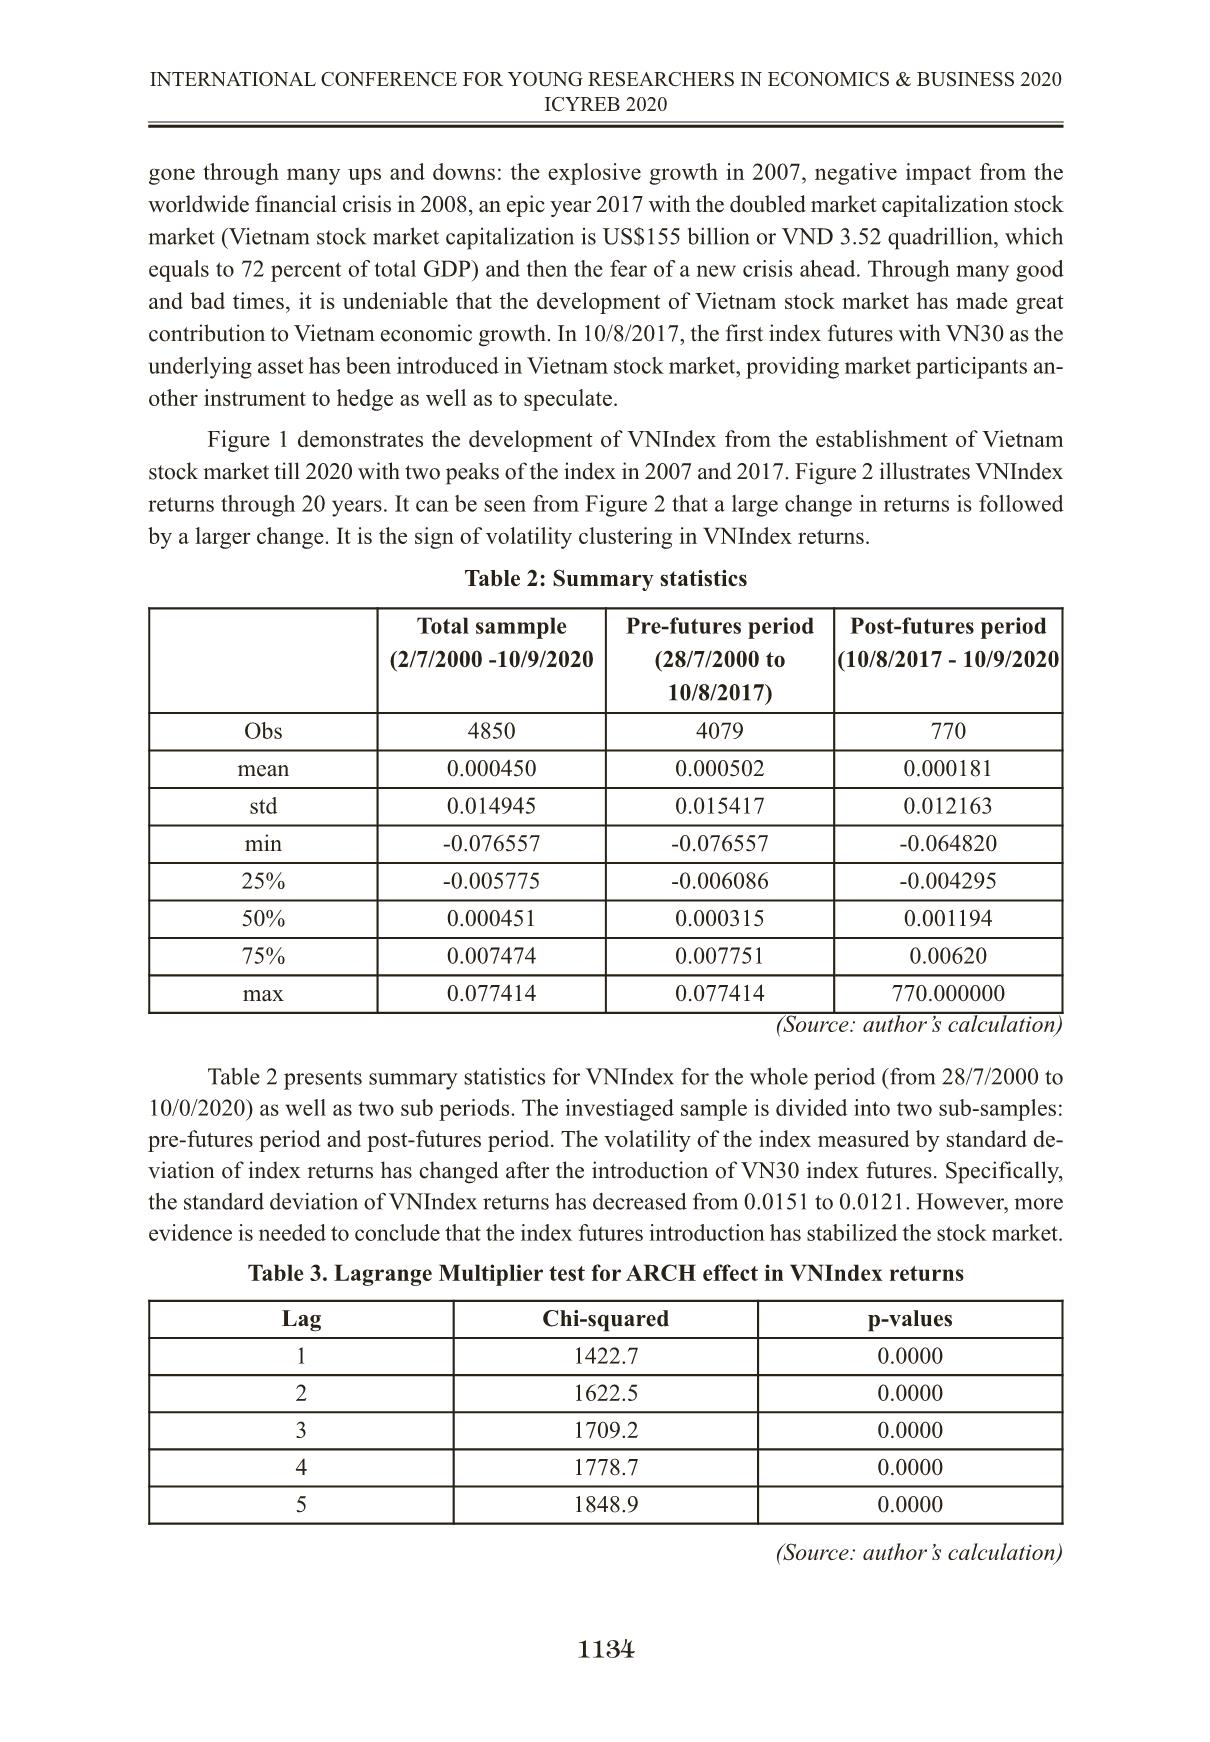
(Source: author’s calculation)
Figure 2: VNIndex continuous compounded rate of return from 28/7/200 to 10/9/2020
Vietnam stock market has officially established in 1998 with the appearance of HOST and
HASTC. The first trading session occurred in 28/7/2000 with the trading of two stocks (REE and
SAM) in Ho Chi Minh City Securities Trading Center. For 20 years, Vietnam stock market has
1133
INTERNATIONAL CONFERENCE FOR YOUNG RESEARCHERS IN ECONOMICS & BUSINESS 2020
ICYREB 2020
gone through many ups and downs: the explosive growth in 2007, negative impact from the
worldwide financial crisis in 2008, an epic year 2017 with the doubled market capitalization stock
market (Vietnam stock market capitalization is US$155 billion or VND 3.52 quadrillion, which
equals to 72 percent of total GDP) and then the fear of a new crisis ahead. Through many good
and bad times, it is undeniable that the development of Vietnam stock market has made great
contribution to Vietnam economic growth. In 10/8/2017, the first index futures with VN30 as the
underlying asset has been introduced in Vietnam stock market, providing market participants an-
other instrument to hedge as well as to speculate.
Figure 1 demonstrates the development of VNIndex from the establishment of Vietnam
stock market till 2020 with two peaks of the index in 2007 and 2017. Figure 2 illustrates VNIndex
returns through 20 years. It can be seen from Figure 2 that a large change in returns is followed
by a larger change. It is the sign of volatility clustering in VNIndex returns.
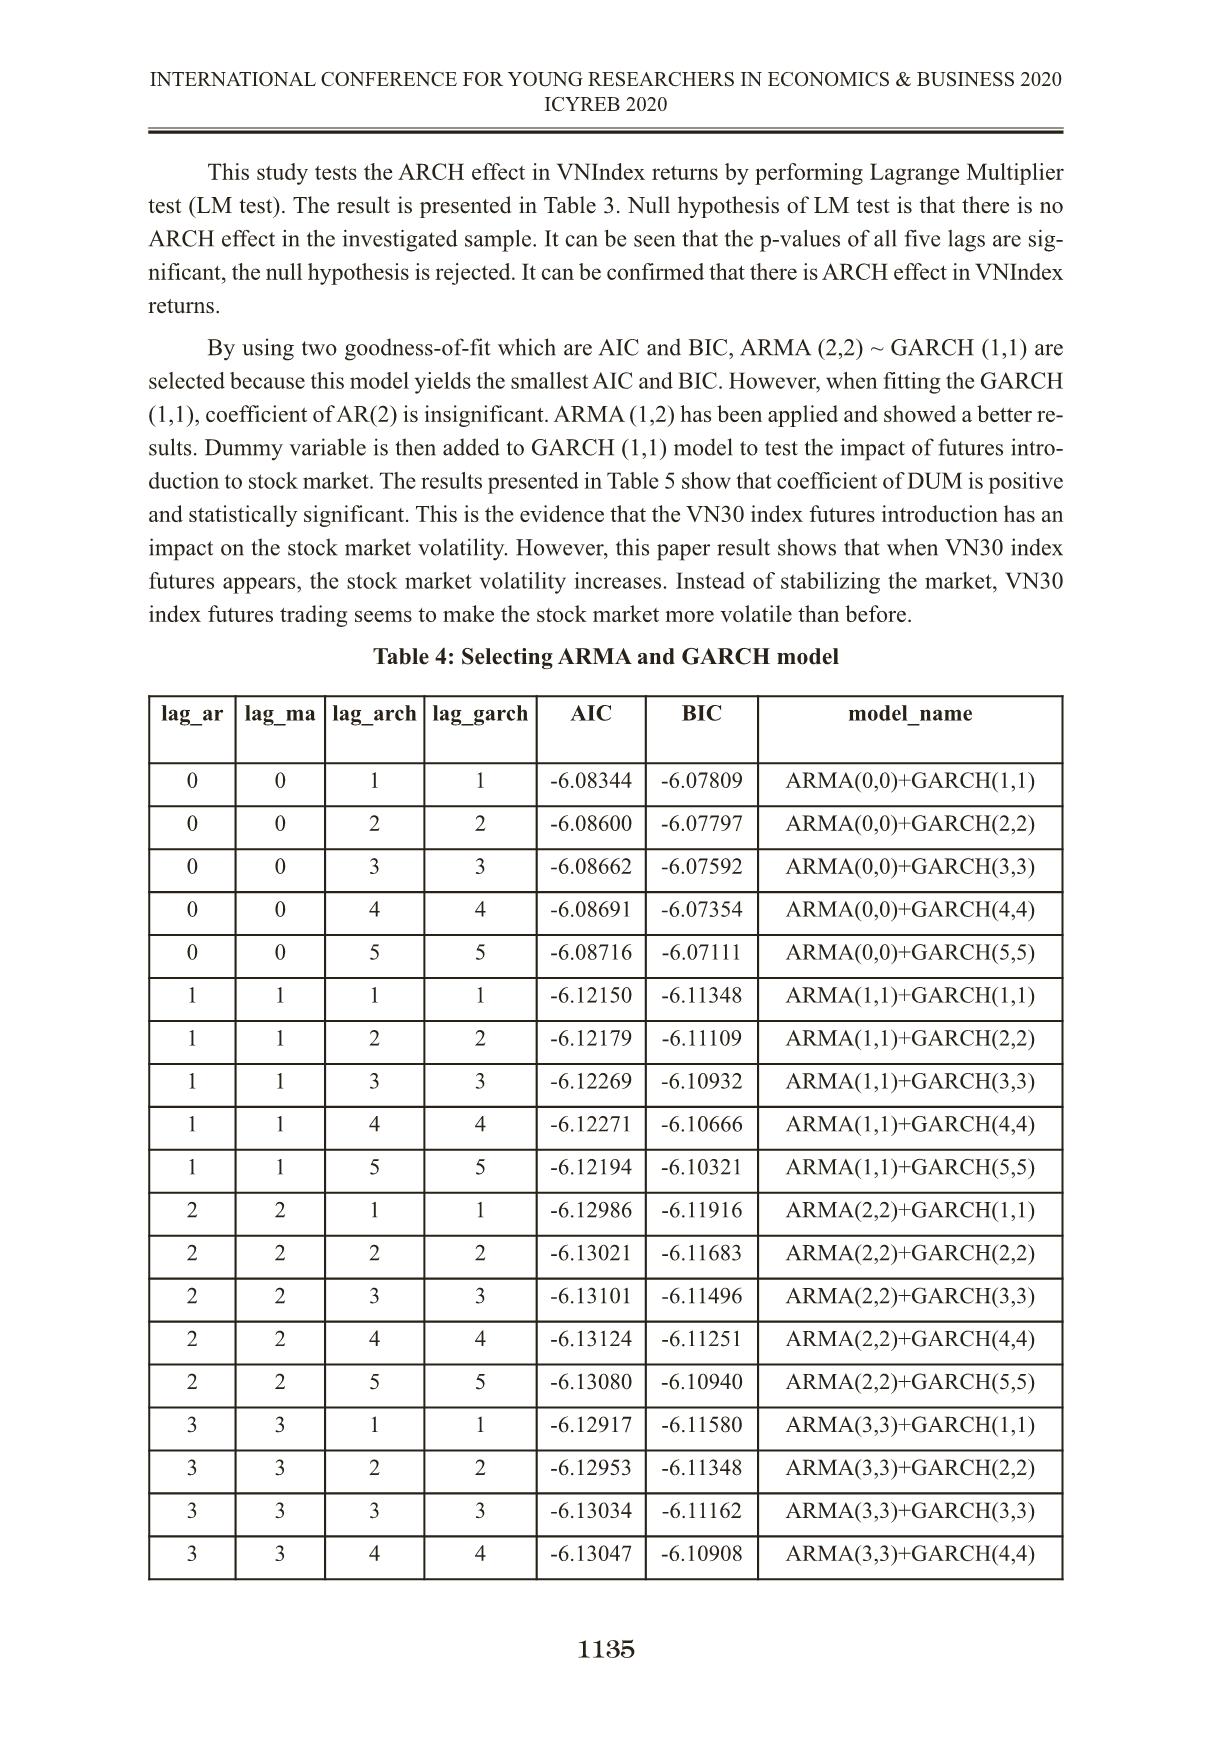
Table 2: Summary statistics
(Source: author’s calculation)
Table 2 presents summary statistics for VNIndex for the whole period (from 28/7/2000 to
10/0/2020) as well as two sub periods. The investiaged sample is divided into two sub-samples:
pre-futures period and post-futures period. The volatility of the index measured by standard de-
viation of index returns has changed after the introduction of VN30 index futures. Specifically,
the standard deviation of VNIndex returns has decreased from 0.0151 to 0.0121. However, more
evidence is needed to conclude that the index futures introduction has stabilized the stock market.
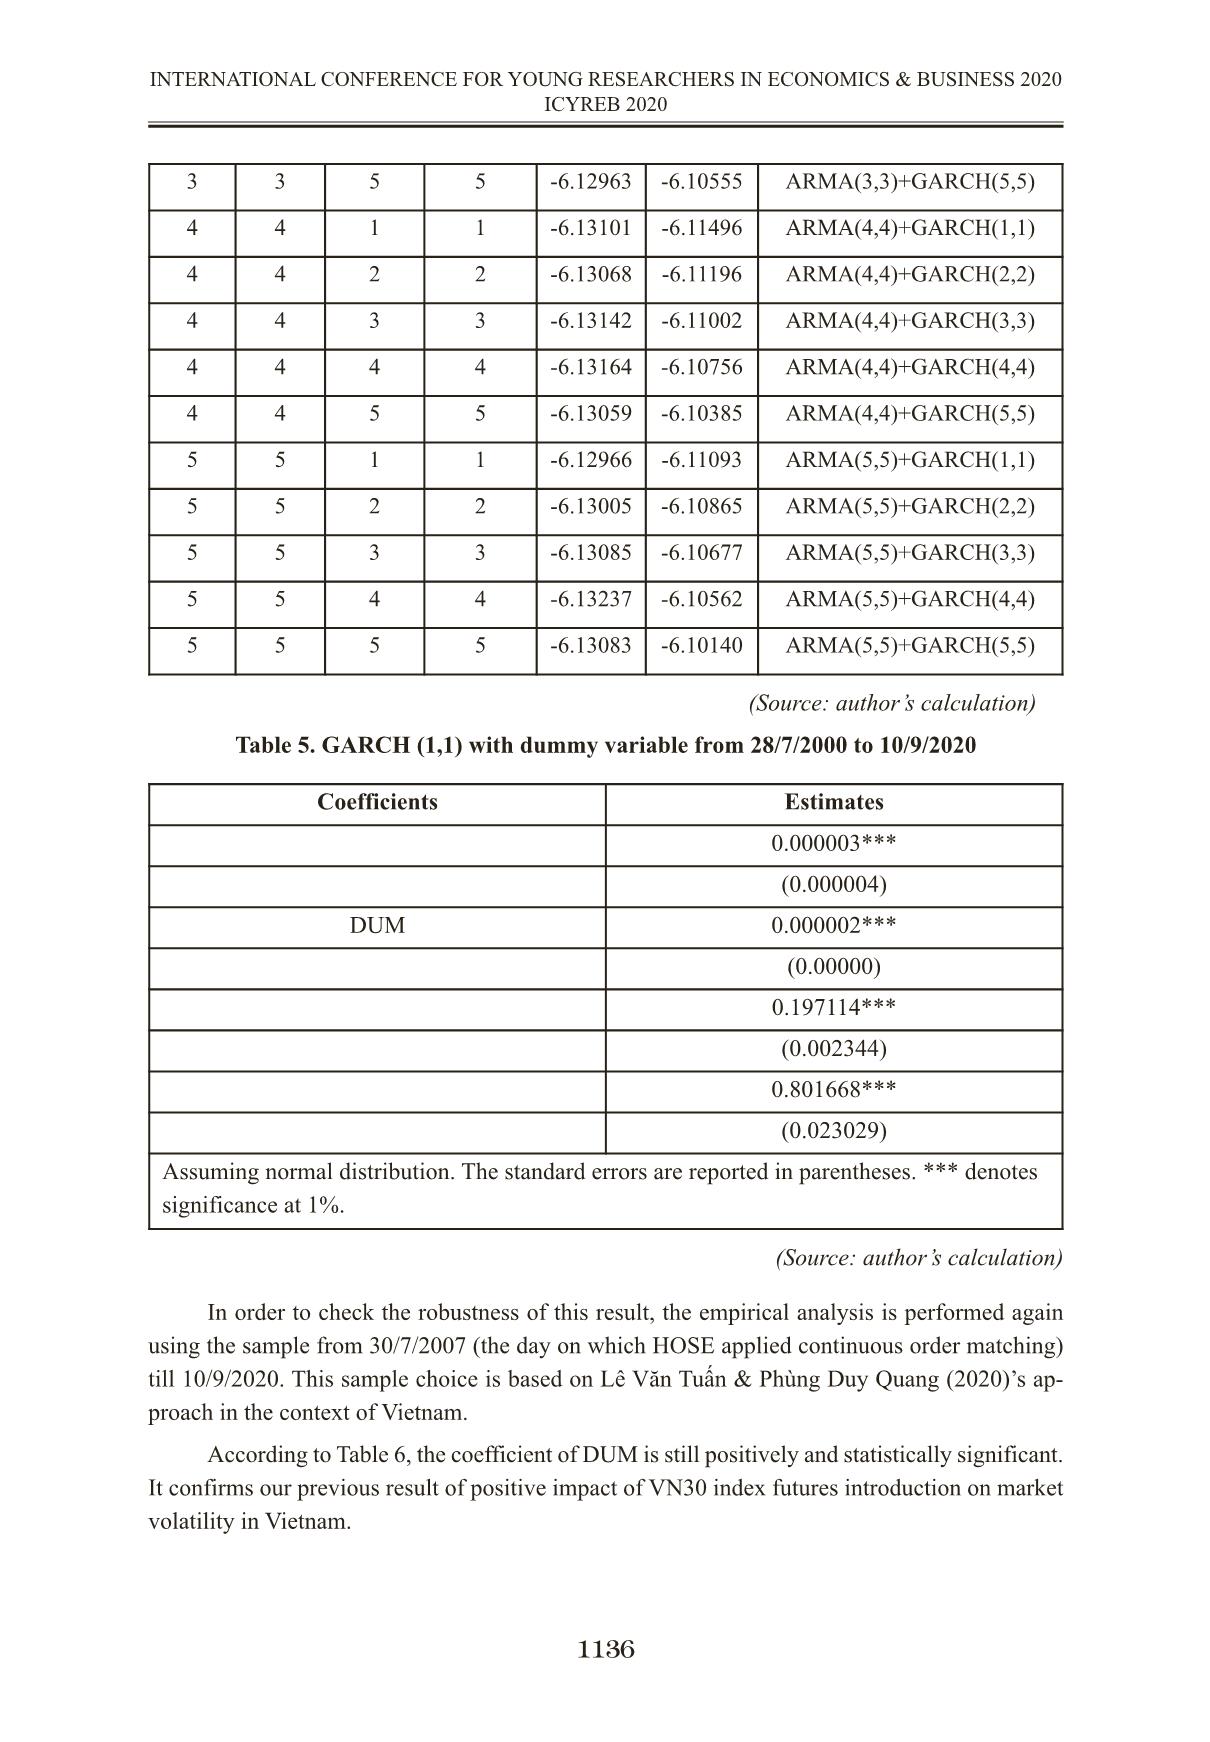
Table 3. Lagrange Multiplier test for ARCH effect in VNIndex returns
(Source: author’s calculation)
1134
INTERNATIONAL CONFERENCE FOR YOUNG RESEARCHERS IN ECONOMICS & BUSINESS 2020
ICYREB 2020
Total sammple
(2/7/2000 -10/9/2020
Pre-futures period
(28/7/2000 to
10/8/2017)
Post-futures period
(10/8/2017 - 10/9/2020
Obs 4850 4079 770
mean 0.000450 0.000502 0.000181
std 0.014945 0.015417 0.012163
min -0.076557 -0.076557 -0.064820
25% -0.005775 -0.006086 -0.004295
50% 0.000451 0.000315 0.001194
75% 0.007474 0.007751 0.00620
max 0.077414 0.077414 770.000000
Lag Chi-squared p-values
1 1422.7 0.0000
2 1622.5 0.0000
3 1709.2 0.0000
4 1778.7 0.0000
5 1848.9 0.0000
This study tests the ARCH effect in VNIndex returns by performing Lagrange Multiplier
test (LM test). The result is presented in Table 3. Null hypothesis of LM test is that there is no
ARCH effect in the investigated sample. It can be seen that the p-values of all five lags are sig-
nificant, the null hypothesis is rejected. It can be confirmed that there is ARCH effect in VNIndex
returns.
By using two goodness-of-fit which are AIC and BIC, ARMA (2,2) ~ GARCH (1,1) are
selected because this model yields the smallest AIC and BIC. However, when fitting the GARCH
(1,1), coefficient of AR(2) is insignificant. ARMA (1,2) has been applied and showed a better re-
sults. Dummy variable is then added to GARCH (1,1) model to test the impact of futures intro-
duction to stock market. The results presented in Table 5 show that coefficient of DUM is positive
and statistically significant. This is the evidence that the VN30 index futures introduction has an
impact on the stock market volatility. However, this paper result shows that when VN30 index
futures appears, the stock market volatility increases. Instead of stabilizing the market, VN30
index futures trading seems to make the stock market more volatile than before.
Table 4: Selecting ARMA and GARCH model
1135
INTERNATIONAL CONFERENCE FOR YOUNG RESEARCHERS IN ECONOMICS & BUSINESS 2020
ICYREB 2020
lag_ar lag_ma lag_arch lag_garch AIC BIC model_name
0 0 1 1 -6.08344 -6.07809 ARMA(0,0)+GARCH(1,1)
0 0 2 2 -6.08600 -6.07797 ARMA(0,0)+GARCH(2,2)
0 0 3 3 -6.08662 -6.07592 ARMA(0,0)+GARCH(3,3)
0 0 4 4 -6.08691 -6.07354 ARMA(0,0)+GARCH(4,4)
0 0 5 5 -6.08716 -6.07111 ARMA(0,0)+GARCH(5,5)
1 1 1 1 -6.12150 -6.11348 ARMA(1,1)+GARCH(1,1)
1 1 2 2 -6.12179 -6.11109 ARMA(1,1)+GARCH(2,2)
1 1 3 3 -6.12269 -6.10932 ARMA(1,1)+GARCH(3,3)
1 1 4 4 -6.12271 -6.10666 ARMA(1,1)+GARCH(4,4)
1 1 5 5 -6.12194 -6.10321 ARMA(1,1)+GARCH(5,5)
2 2 1 1 -6.12986 -6.11916 ARMA(2,2)+GARCH(1,1)
2 2 2 2 -6.13021 -6.11683 ARMA(2,2)+GARCH(2,2)
2 2 3 3 -6.13101 -6.11496 ARMA(2,2)+GARCH(3,3)
2 2 4 4 -6.13124 -6.11251 ARMA(2,2)+GARCH(4,4)
2 2 5 5 -6.13080 -6.10940 ARMA(2,2)+GARCH(5,5)
3 3 1 1 -6.12917 -6.11580 ARMA(3,3)+GARCH(1,1)
3 3 2 2 -6.12953 -6.11348 ARMA(3,3)+GARCH(2,2)
3 3 3 3 -6.13034 -6.11162 ARMA(3,3)+GARCH(3,3)
3 3 4 4 -6.13047 -6.10908 ARMA(3,3)+GARCH(4,4)
(Source: author’s calculation)
Table 5. GARCH (1,1) with dummy variable from 28/7/2000 to 10/9/2020
(Source: author’s calculation)
In order to check the robustness of this result, the empirical analysis is performed again
using the sample from 30/7/2007 (the day on which HOSE applied continuous order matching)
till 10/9/2020. This sample choice is based on Lê Văn Tuấn & Phùng Duy Quang (2020)’s ap-
proach in the context of Vietnam.
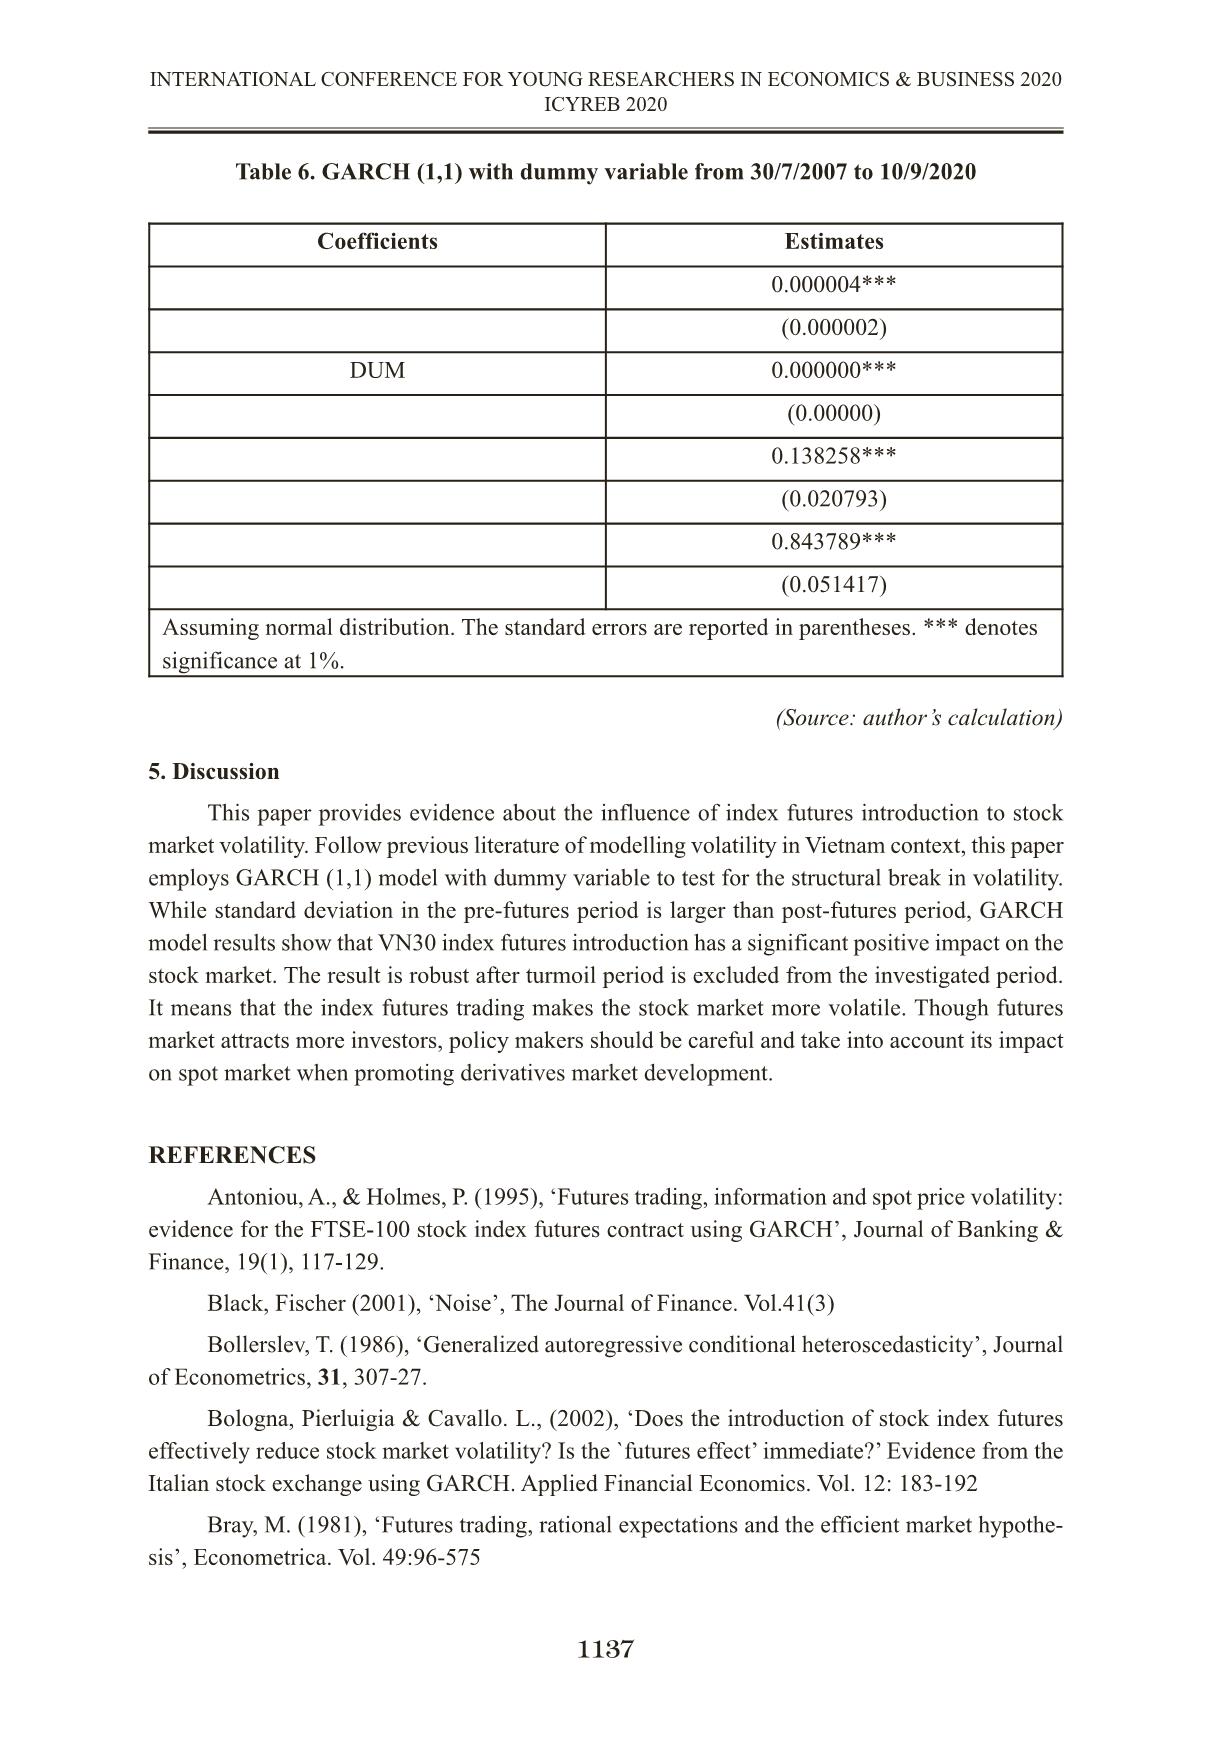
According to Table 6, the coefficient of DUM is still positively and statistically significant.
It confirms our previous result of positive impact of VN30 index futures introduction on market
volatility in Vietnam.
1136
INTERNATIONAL CONFERENCE FOR YOUNG RESEARCHERS IN ECONOMICS & BUSINESS 2020
ICYREB 2020
3 3 5 5 -6.12963 -6.10555 ARMA(3,3)+GARCH(5,5)
4 4 1 1 -6.13101 -6.11496 ARMA(4,4)+GARCH(1,1)
4 4 2 2 -6.13068 -6.11196 ARMA(4,4)+GARCH(2,2)
4 4 3 3 -6.13142 -6.11002 ARMA(4,4)+GARCH(3,3)
4 4 4 4 -6.13164 -6.10756 ARMA(4,4)+GARCH(4,4)
4 4 5 5 -6.13059 -6.10385 ARMA(4,4)+GARCH(5,5)
5 5 1 1 -6.12966 -6.11093 ARMA(5,5)+GARCH(1,1)
5 5 2 2 -6.13005 -6.10865 ARMA(5,5)+GARCH(2,2)
5 5 3 3 -6.13085 -6.10677 ARMA(5,5)+GARCH(3,3)
5 5 4 4 -6.13237 -6.10562 ARMA(5,5)+GARCH(4,4)
5 5 5 5 -6.13083 -6.10140 ARMA(5,5)+GARCH(5,5)
Coefficients Estimates
0.000003***
(0.000004)
DUM 0.000002***
(0.00000)
0.197114***
(0.002344)
0.801668***
(0.023029)
Assuming normal distribution. The standard errors are reported in parentheses. *** denotes
significance at 1%.
Table 6. GARCH (1,1) with dummy variable from 30/7/2007 to 10/9/2020
(Source: author’s calculation)
5. Discussion
This paper provides evidence about the influence of index futures introduction to stock
market volatility. Follow previous literature of modelling volatility in Vietnam context, this paper
employs GARCH (1,1) model with dummy variable to test for the structural break in volatility.
While standard deviation in the pre-futures period is larger than post-futures period, GARCH
model results show that VN30 index futures introduction has a significant positive impact on the
stock market. The result is robust after turmoil period is excluded from the investigated period.
It means that the index futures trading makes the stock market more volatile. Though futures
market attracts more investors, policy makers should be careful and take into account its impact
on spot market when promoting derivatives market development.
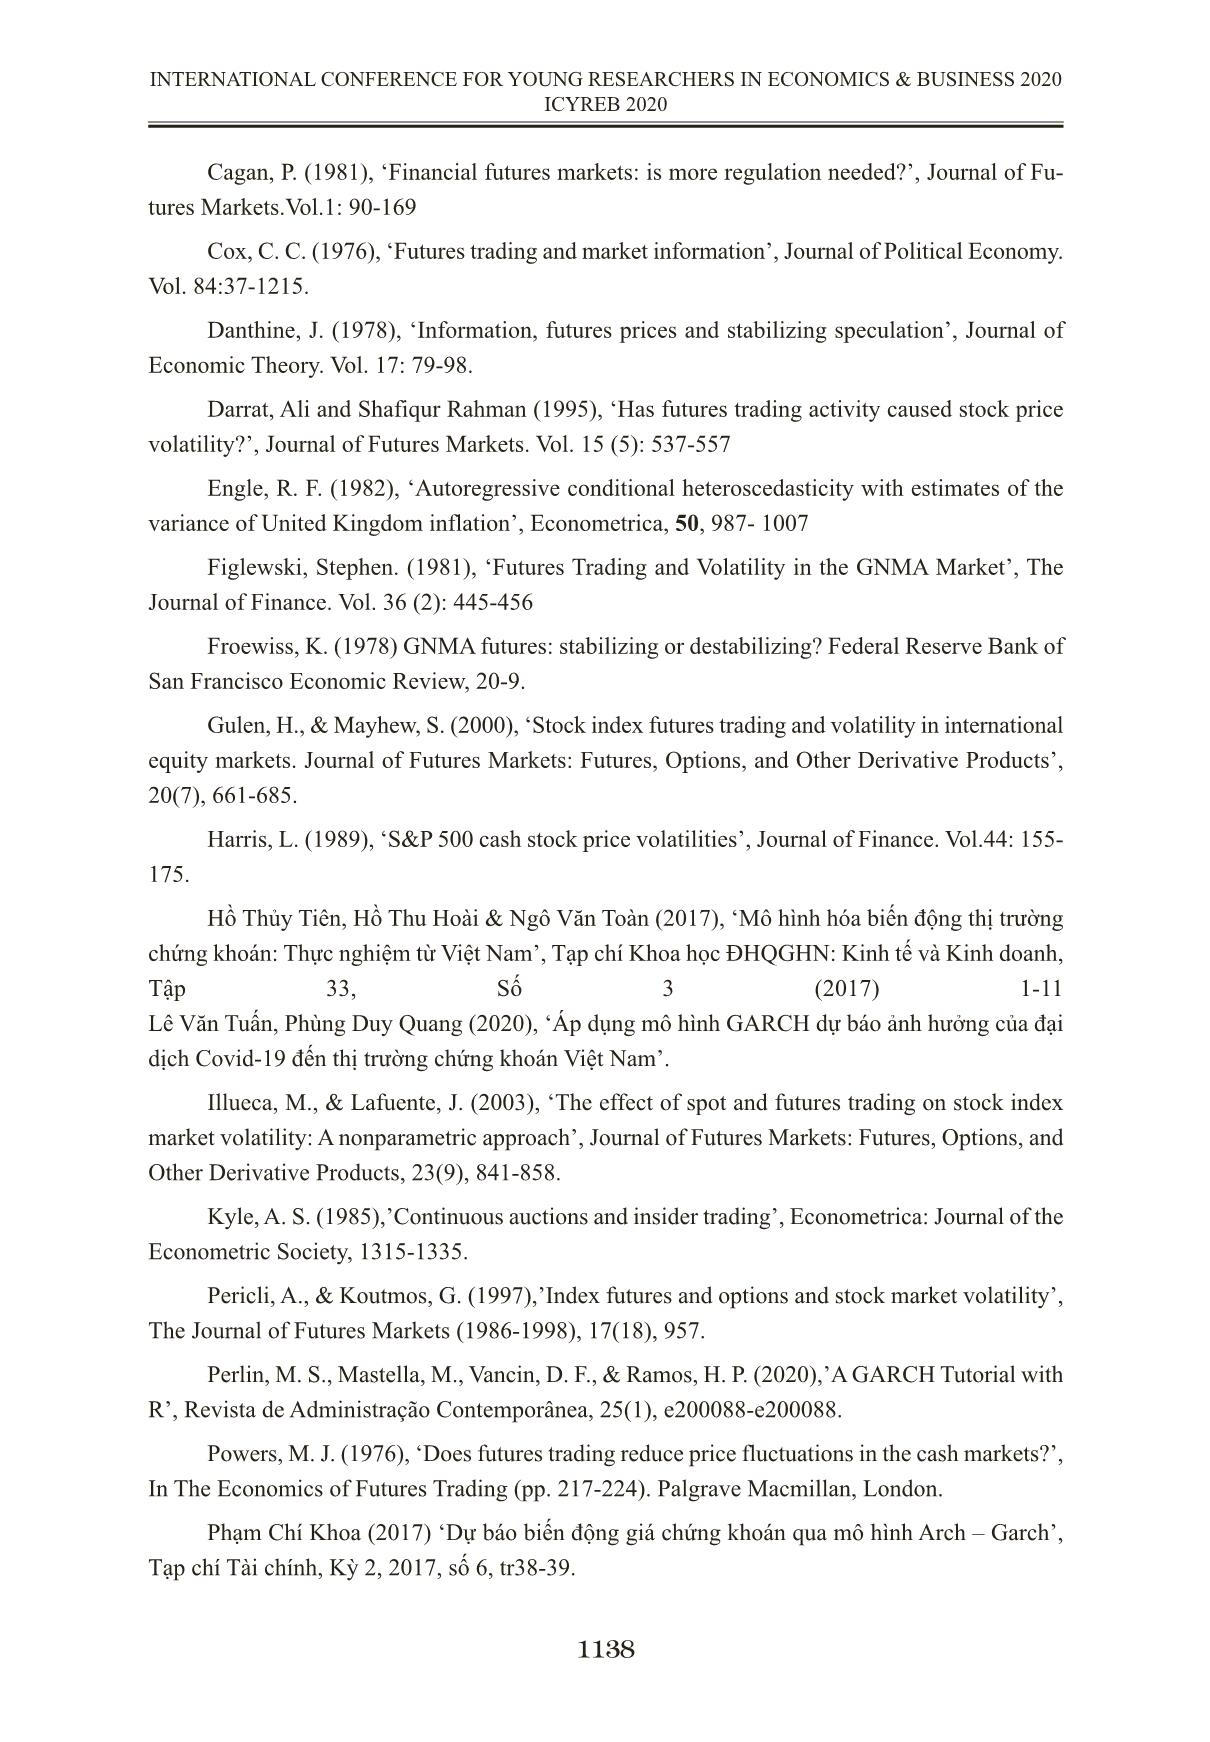
REFERENCES
Antoniou, A., & Holmes, P. (1995), ‘Futures trading, information and spot price volatility:
evidence for the FTSE-100 stock index futures contract using GARCH’, Journal of Banking &
Finance, 19(1), 117-129.
Black, Fischer (2001), ‘Noise’, The Journal of Finance. Vol.41(3)
Bollerslev, T. (1986), ‘Generalized autoregressive conditional heteroscedasticity’, Journal
of Econometrics, 31, 307-27.
Bologna, Pierluigia & Cavallo. L., (2002), ‘Does the introduction of stock index futures
effectively reduce stock market volatility? Is the `futures effect’ immediate?’ Evidence from the
Italian stock exchange using GARCH. Applied Financial Economics. Vol. 12: 183-192
Bray, M. (1981), ‘Futures trading, rational expectations and the efficient market hypothe-
sis’, Econometrica. Vol. 49:96-575
1137
INTERNATIONAL CONFERENCE FOR YOUNG RESEARCHERS IN ECONOMICS & BUSINESS 2020
ICYREB 2020
Coefficients Estimates
0.000004***
(0.000002)
DUM 0.000000***
(0.00000)
0.138258***
(0.020793)
0.843789***
(0.051417)
Assuming normal distribution. The standard errors are reported in parentheses. *** denotes
significance at 1%.
Cagan, P. (1981), ‘Financial futures markets: is more regulation needed?’, Journal of Fu-
tures Markets.Vol.1: 90-169
Cox, C. C. (1976), ‘Futures trading and market information’, Journal of Political Economy.
Vol. 84:37-1215.
Danthine, J. (1978), ‘Information, futures prices and stabilizing speculation’, Journal of
Economic Theory. Vol. 17: 79-98.
Darrat, Ali and Shafiqur Rahman (1995), ‘Has futures trading activity caused stock price
volatility?’, Journal of Futures Markets. Vol. 15 (5): 537-557
Engle, R. F. (1982), ‘Autoregressive conditional heteroscedasticity with estimates of the
variance of United Kingdom inflation’, Econometrica, 50, 987- 1007
Figlewski, Stephen. (1981), ‘Futures Trading and Volatility in the GNMA Market’, The
Journal of Finance. Vol. 36 (2): 445-456
Froewiss, K. (1978) GNMA futures: stabilizing or destabilizing? Federal Reserve Bank of
San Francisco Economic Review, 20-9.
Gulen, H., & Mayhew, S. (2000), ‘Stock index futures trading and volatility in international
equity markets. Journal of Futures Markets: Futures, Options, and Other Derivative Products’,
20(7), 661-685.
Harris, L. (1989), ‘S&P 500 cash stock price volatilities’, Journal of Finance. Vol.44: 155-
175.
Hồ Thủy Tiên, Hồ Thu Hoài & Ngô Văn Toàn (2017), ‘Mô hình hóa biến động thị trường
chứng khoán: Thực nghiệm từ Việt Nam’, Tạp chí Khoa học ĐHQGHN: Kinh tế và Kinh doanh,
Tập 33, Số 3 (2017) 1-11
Lê Văn Tuấn, Phùng Duy Quang (2020), ‘Áp dụng mô hình GARCH dự báo ảnh hưởng của đại
dịch Covid-19 đến thị trường chứng khoán Việt Nam’.
Illueca, M., & Lafuente, J. (2003), ‘The effect of spot and futures trading on stock index
market volatility: A nonparametric approach’, Journal of Futures Markets: Futures, Options, and
Other Derivative Products, 23(9), 841-858.
Kyle, A. S. (1985),’Continuous auctions and insider trading’, Econometrica: Journal of the
Econometric Society, 1315-1335.
Pericli, A., & Koutmos, G. (1997),’Index futures and options and stock market volatility’,
The Journal of Futures Markets (1986-1998), 17(18), 957.
Perlin, M. S., Mastella, M., Vancin, D. F., & Ramos, H. P. (2020),’A GARCH Tutorial with
R’, Revista de Administração Contemporânea, 25(1), e200088-e200088.
Powers, M. J. (1976), ‘Does futures trading reduce price fluctuations in the cash markets?’,
In The Economics of Futures Trading (pp. 217-224). Palgrave Macmillan, London.
Phạm Chí Khoa (2017) ‘Dự báo biến động giá chứng khoán qua mô hình Arch – Garch’,
Tạp chí Tài chính, Kỳ 2, 2017, số 6, tr38-39.
1138
INTERNATIONAL CONFERENCE FOR YOUNG RESEARCHERS IN ECONOMICS & BUSINESS 2020
ICYREB 2020
Schwarz, T. V., & Laatsch, F. E. (1991).’Dynamic efficiency and price leadership in stock
index cash and futures markets’, The Journal of Futures Markets (1986-1998), 11(6), 669.
Stein, J. C. (1987), ’Informational externalities and welfare-reducing speculation’, Journal
of political economy, 95(6), 1123-1145.
Stoll, H. R., & Whaley, R. E. (1988). ‘Volatility and futures: Message versus messenger’,
Journal of Portfolio Management, 14(2), 20.
Vương Quân Hoàng (2004), ‘Hiệu ứng GARCH trên dãy lợi suất thị trường chứng khoán
Việt Nam 2000-2003’, Tạp chí Ứng dụng toán học tập II, số 1, 2004
Wang, C. H., Lin, C. C., Lin, S. H., & Lai, H. Y. (2020),‘A new dynamic hedging model
with futures: The kalman filter error-correction model’, Journal of Operational Risk, 22(4).
1139
INTERNATIONAL CONFERENCE FOR YOUNG RESEARCHERS IN ECONOMICS & BUSINESS 2020
ICYREB 2020
File đính kèm:
 su_xuat_hien_cua_hop_dong_tuong_lai_chi_so_va_su_bien_dong_c.pdf

