Structure of GeO₂ glass under compression using molecular dynamics simulation
Because of its importance in industry, GeO2 glass has been extensively studied both experimentally
and theoretically. In ref.[2], Dong et.al investigate the pressure-induced structural changes and
polyamorphism of GeO2 glasses by using X-ray and Neutron diffraction. Extended X-Ray Absorption
Fine Structure (EXAFS) experiment reveals that structural transformation in GeO2 glass occurs in a
wide pressure range up to 54 GPa. At low pressure (< 5 GPa) the Ge-O bond distance is almost
unchanged with pressure. The degree of structural disorder increases with pressure. In 5-16 GPa pressure
range, it shows the increase of Ge-O bond distance and bond disorder to maximum. In 16 -23 GPa
pressure range, the Ge-O bond distance decreases significantly; increases slightly from 22,6 to 32,7GPa;
decreases as pressure increase from 32,4 to 41,4 GPa and slightly increases up to 54 GPa.
At ultra-high pressure, GeO2 glass has the polyamorphism with Coordination Number (CN) more
than 6. In the work [3], Kono et. al reveal that CN is6 between 22,6 to 37,9 GPa. At higher pressures,
CN increases rapidly and reaches 7,4 at 91,7 GPa.
Trang 1
Trang 2
Trang 3
Trang 4
Trang 5
Trang 6
Trang 7
Trang 8
Trang 9
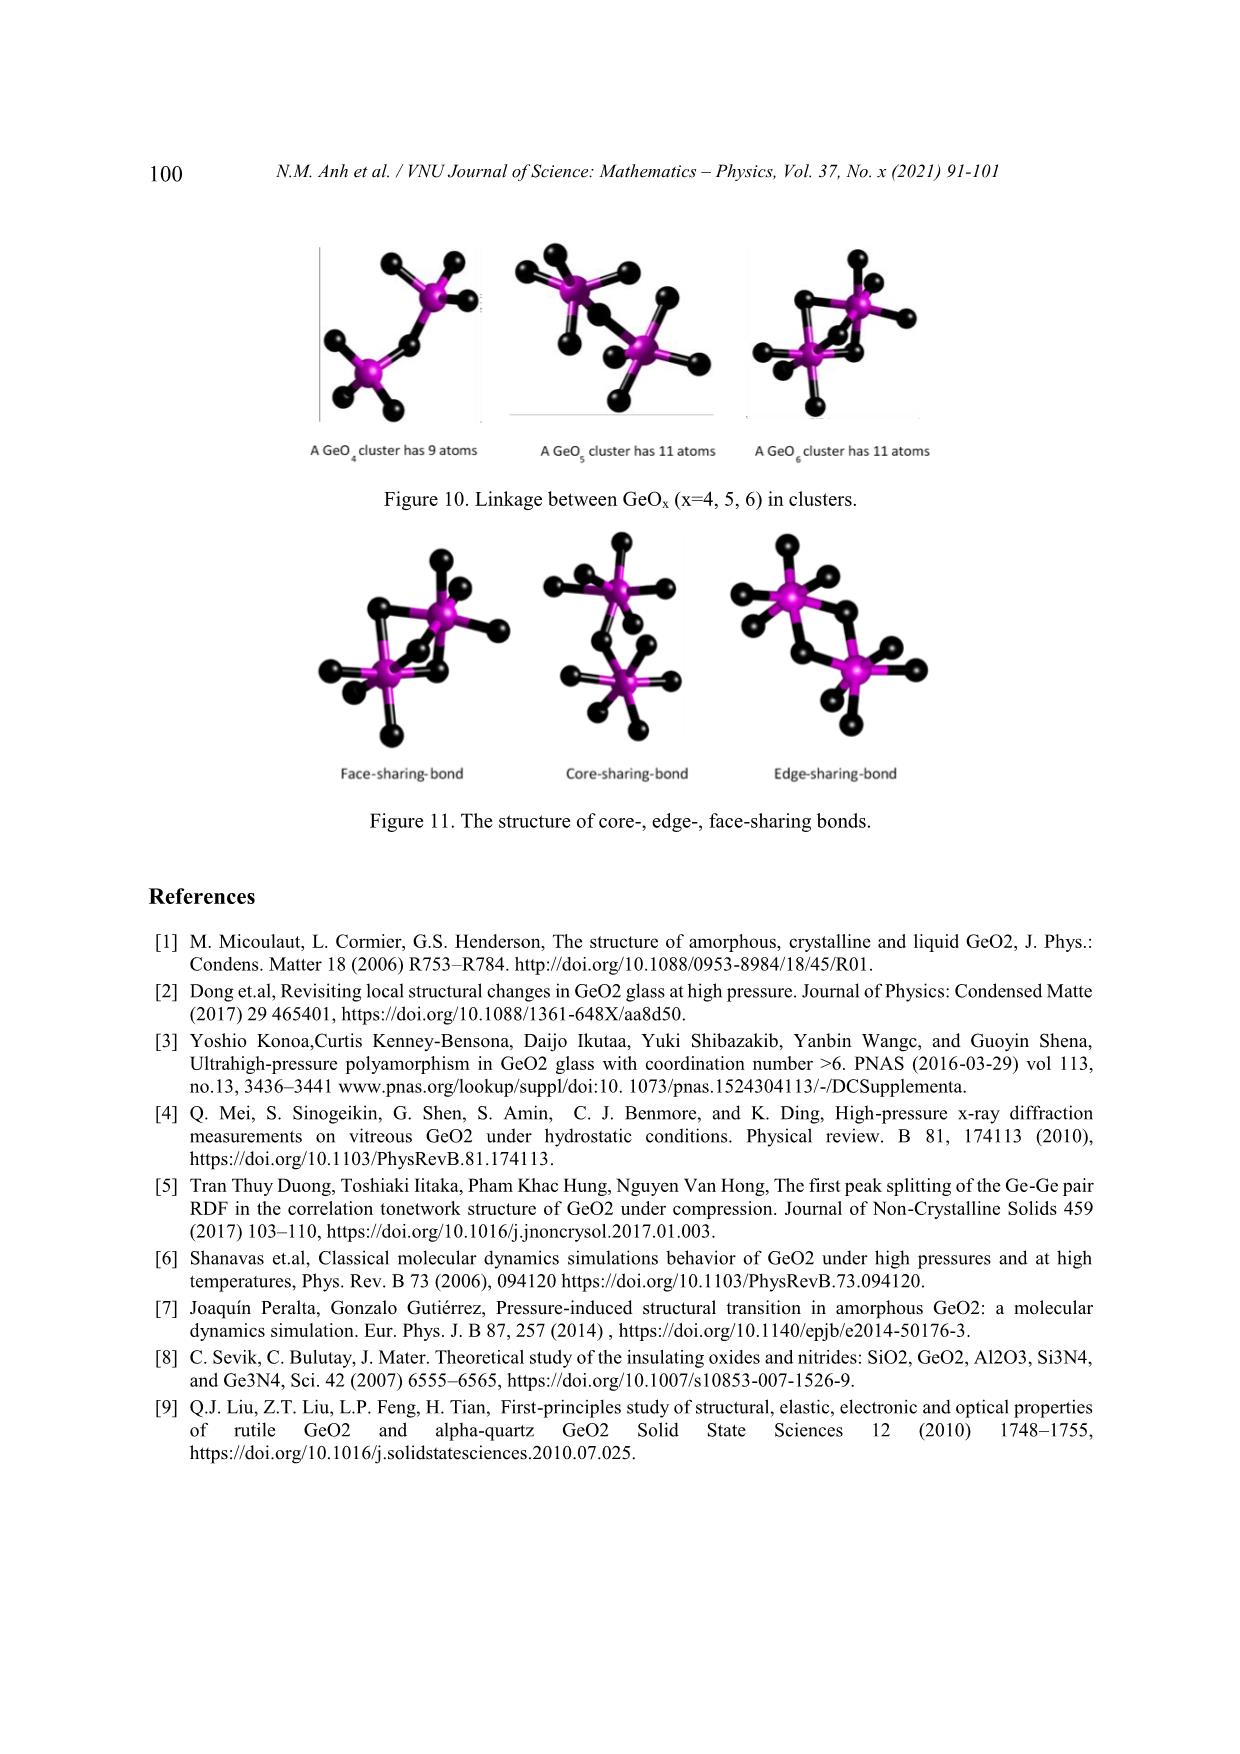
Trang 10
Tải về để xem bản đầy đủ
Tóm tắt nội dung tài liệu: Structure of GeO₂ glass under compression using molecular dynamics simulation
 VNU Journal of Science: Mathematics – Physics, Vol. 37, No. x (2021) 91-101
 Original Article
 Structure of GeO2 Glass under Compression
 Using Molecular Dynamics Simulation
 Nguyen Mai Anh*, Nguyen Thi Thu Trang,
 To Thi Nguyet, Nguyen Van Linh
 Ha Noi University of Science and Technology, 1 Dai Co Viet, Hai Ba Trung, Hanoi, Vietnam
 Received 14 December 2019
 Revised 11 June 2020; Accepted 15 August 2020
 Abstract: We have investigated the behavior of GeO2 at the temperature of 300 K and the pressure
 from 0 to 100GPa by using the molecular dynamics simulation (the model with 5499 atoms). The
 results show that the Ge-Ge, Ge-O bond distance increase but O-O bond distance decreases when
 increasing the pressure. We find that the peak splitting of Ge-Ge at high pressure corresponds with
 the Ge-O-Ge and O-Ge-O bond angles. We also find that O-Ge-O bond angle decreases, and Ge-O-
 Ge bond angle increases with pressure. The core-sharing-bond is major at ambient pressure, but
 fractions of edge and face-sharing-bonds increase with pressure.
 Keywords: GeO2, High pressure, Microstructure, Radial distribution functions (RDFs), Molecular
 Dynamics simulation, clusters.
1. Introduction
 Germanium dioxide (GeO2) is a compound formed as a passivation layer on pure germanium in
contact with atmospheric oxygen. In different temperatures and pressures, GeO2 exists in α -quartz
trigonal structure, rutile-like structure with tetragonal structure and an amorphous [1]. An amorphous
form of GeO2 is similar to fused silica. The α-quartz-type structure has been studied by using both
experiment [2- 4], simulation [5-7] and theory [8, 9]. The calculations of the geometric structure and the
physical properties of rutile-type GeO2 phase are also investigated in many studies [10]. The amorphous
form of GeO2 is researched in [2, 11].
________
 Corresponding author.
 Email address: anh.nm175671@sis.hust.edu.vn
 https//doi.org/ 10.25073/2588-1124/vnumap.4445
 91
92 N.M. Anh et al. / VNU Journal of Science: Mathematics – Physics, Vol. 37, No. x (2021) 91-101
 Because of its importance in industry, GeO2 glass has been extensively studied both experimentally
and theoretically. In ref.[2], Dong et.al investigate the pressure-induced structural changes and
polyamorphism of GeO2 glasses by using X-ray and Neutron diffraction. Extended X-Ray Absorption
Fine Structure (EXAFS) experiment reveals that structural transformation in GeO2 glass occurs in a
wide pressure range up to 54 GPa. At low pressure (< 5 GPa) the Ge-O bond distance is almost
unchanged with pressure. The degree of structural disorder increases with pressure. In 5-16 GPa pressure
range, it shows the increase of Ge-O bond distance and bond disorder to maximum. In 16 -23 GPa
pressure range, the Ge-O bond distance decreases significantly; increases slightly from 22,6 to 32,7GPa;
decreases as pressure increase from 32,4 to 41,4 GPa and slightly increases up to 54 GPa.
 At ultra-high pressure, GeO2 glass has the polyamorphism with Coordination Number (CN) more
than 6. In the work [3], Kono et. al reveal that CN is6 between 22,6 to 37,9 GPa. At higher pressures,
CN increases rapidly and reaches 7,4 at 91,7 GPa.
 The investigation shows that Radial Distribution Function (RDF) of Ge-Ge has double peak, so Ge-
Ge bond length comprises two value: 2.82 and Å at 22.6 GPa; 2,79 and 3.24 Å at 37.9 GPa; 2.73 and
3.15Å at 49.4 GPa; 2.73 and 3.13 Å at 61.4 GPa. The double peak tends to merge into a single peak as
pressure increases (>72.5 Gpa). In ref.[5], the authors also study the first peak splitting of Ge-Ge pair
RDF. They investigate short range order (SRO) and intermediate range order (IRO) of GeO2 at 3500 K
using molecular dynamics (MD), in pressure from 0 to 100 GPa.
 They found that GeO4 tetrahedra link to each other to form a tetrahedral network. As pressure
increases, tetrahedral network transits to octahedral network (GeO6) via GeO5 polyhedra. At a middle
pressure, GeO2 exists in three forms GeO4, GeO5, GeO6. GeO5-cluster reaches the maximum at 15-20
GPa. The authors found that it exists as an immediate configuration in structural transition process.
Investigation shows that at low pressure, GeOx (x=4,5,6) link to each other by one common oxygen (
corner-sharing bond, see figure 11) and at high pressure, by a corner-sharing bond, edge-sharing bond
(two common oxygenssee figure 11), and face-sharing bond (three common oxygens, see figure 11). At
high pressure, the GeO5, GeO6 polyhedra are dominant and tend to link each other by edge-sharing and
face-sharing bonds, which become edge-sharing and face-sharing clusters. In ref.[12], the structure of
GeO2 glass is investigated at pressures up to 17.5(5) GPa using insitu time-of-flight neutron diffraction
with a Paris–Edinburgh press employing sintered diamond anvils. At low pressure (5 GPa), it exists
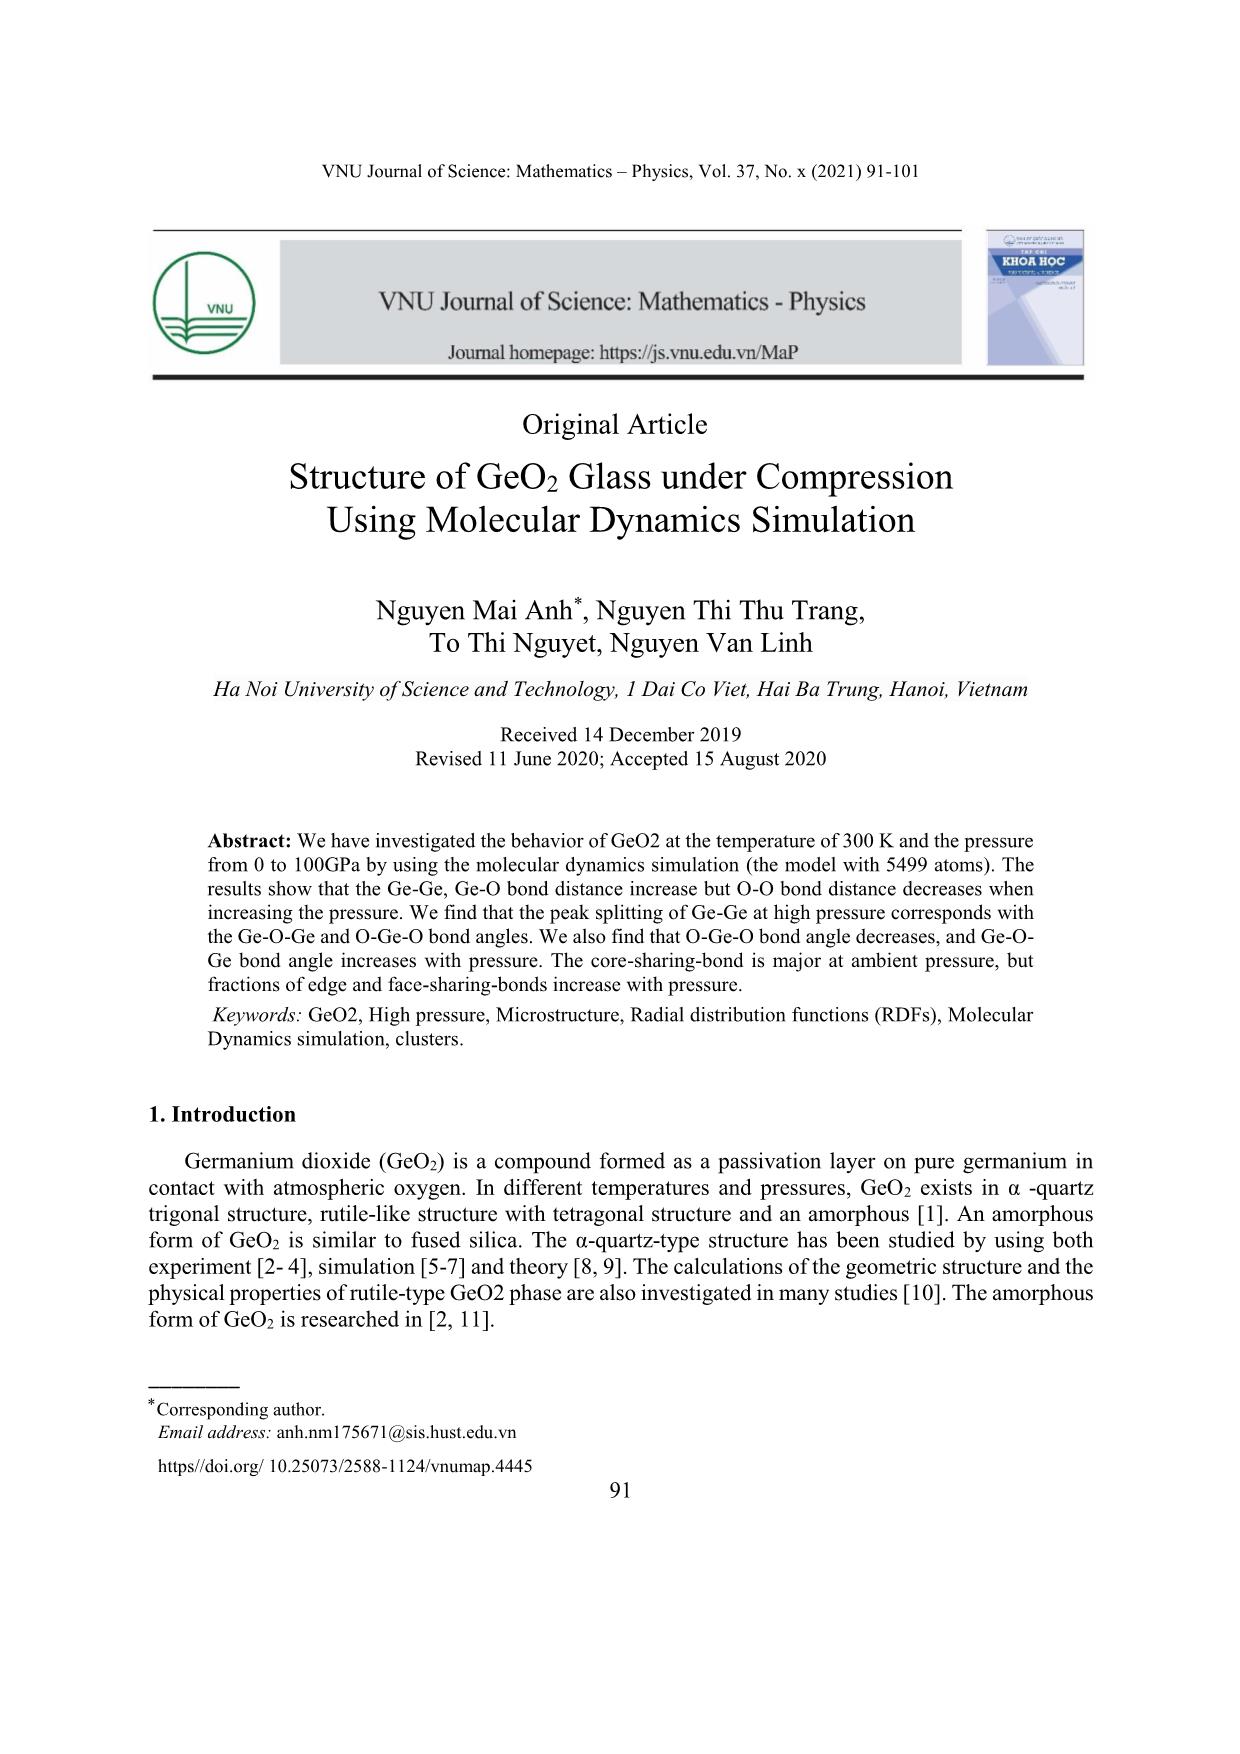
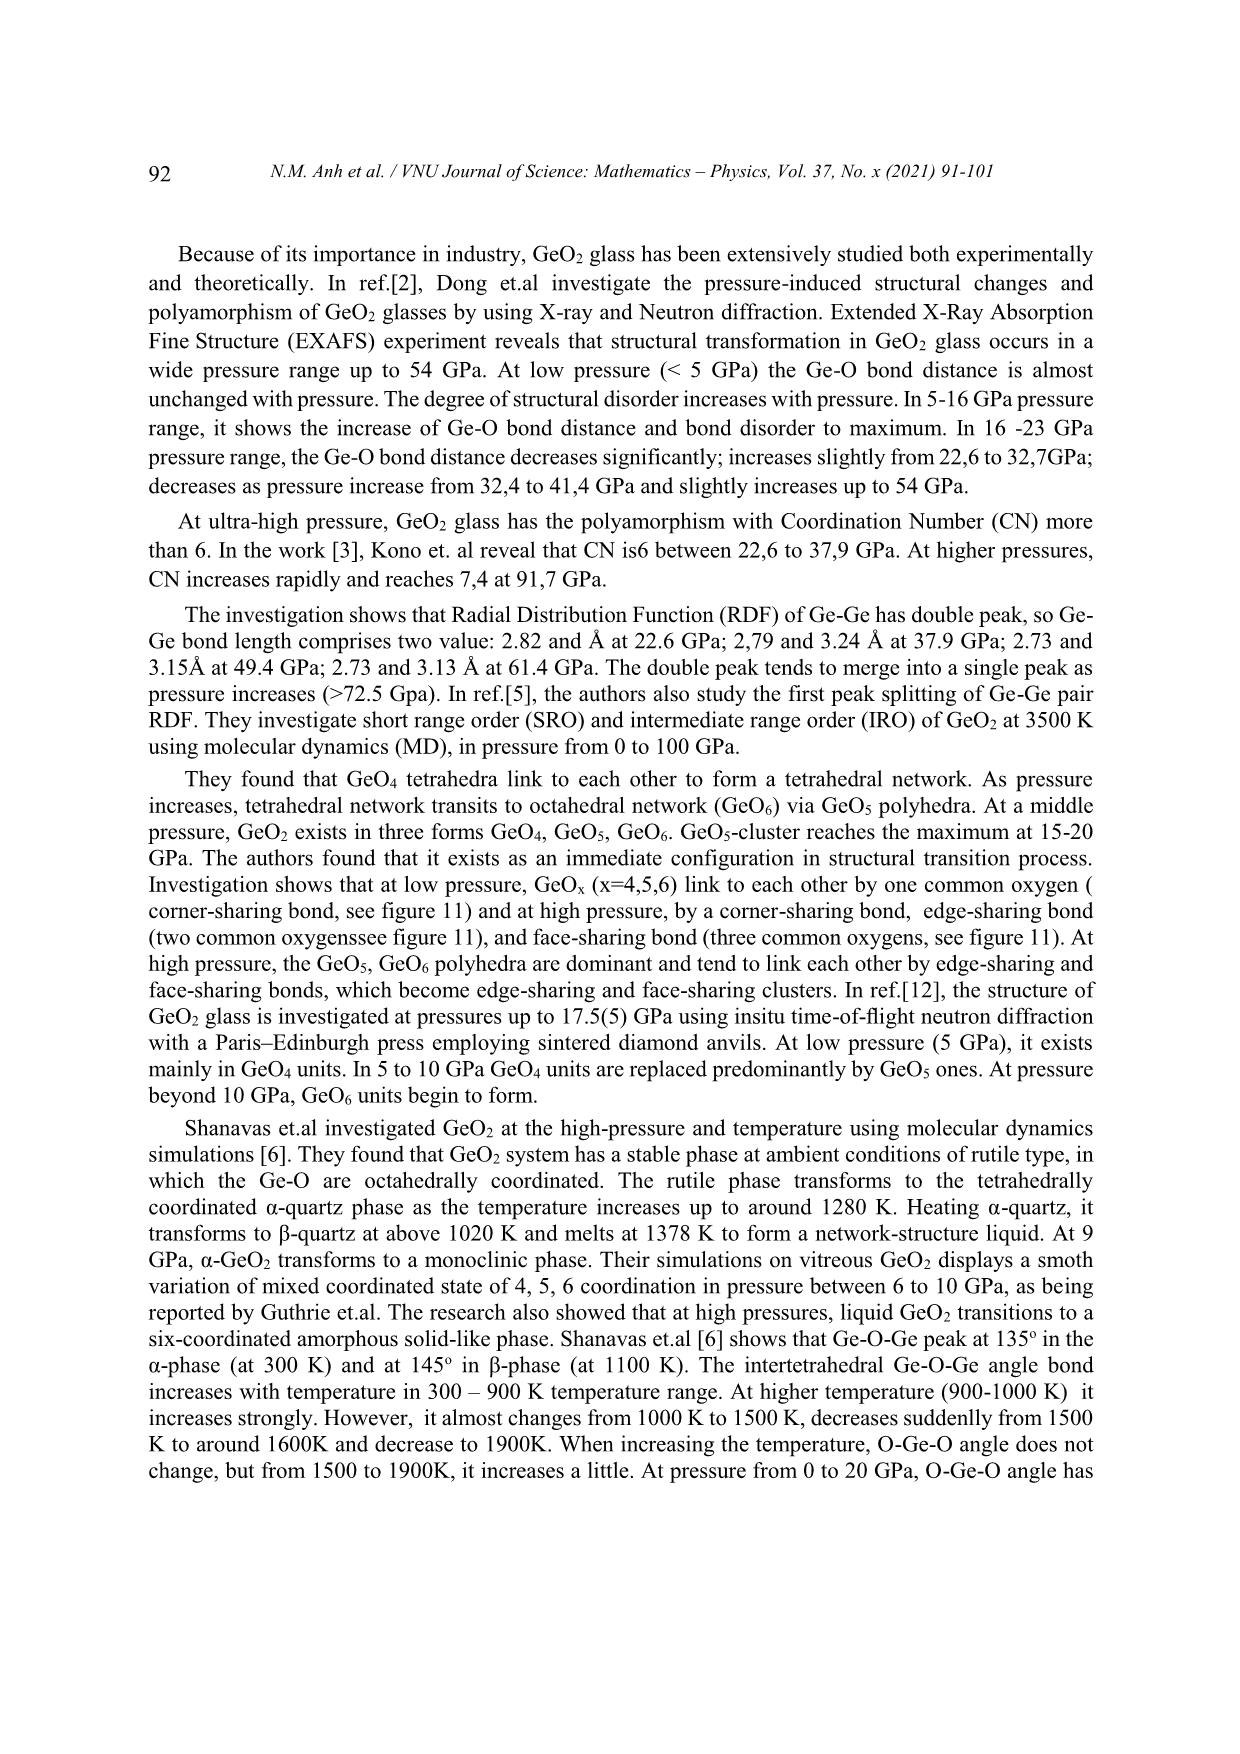
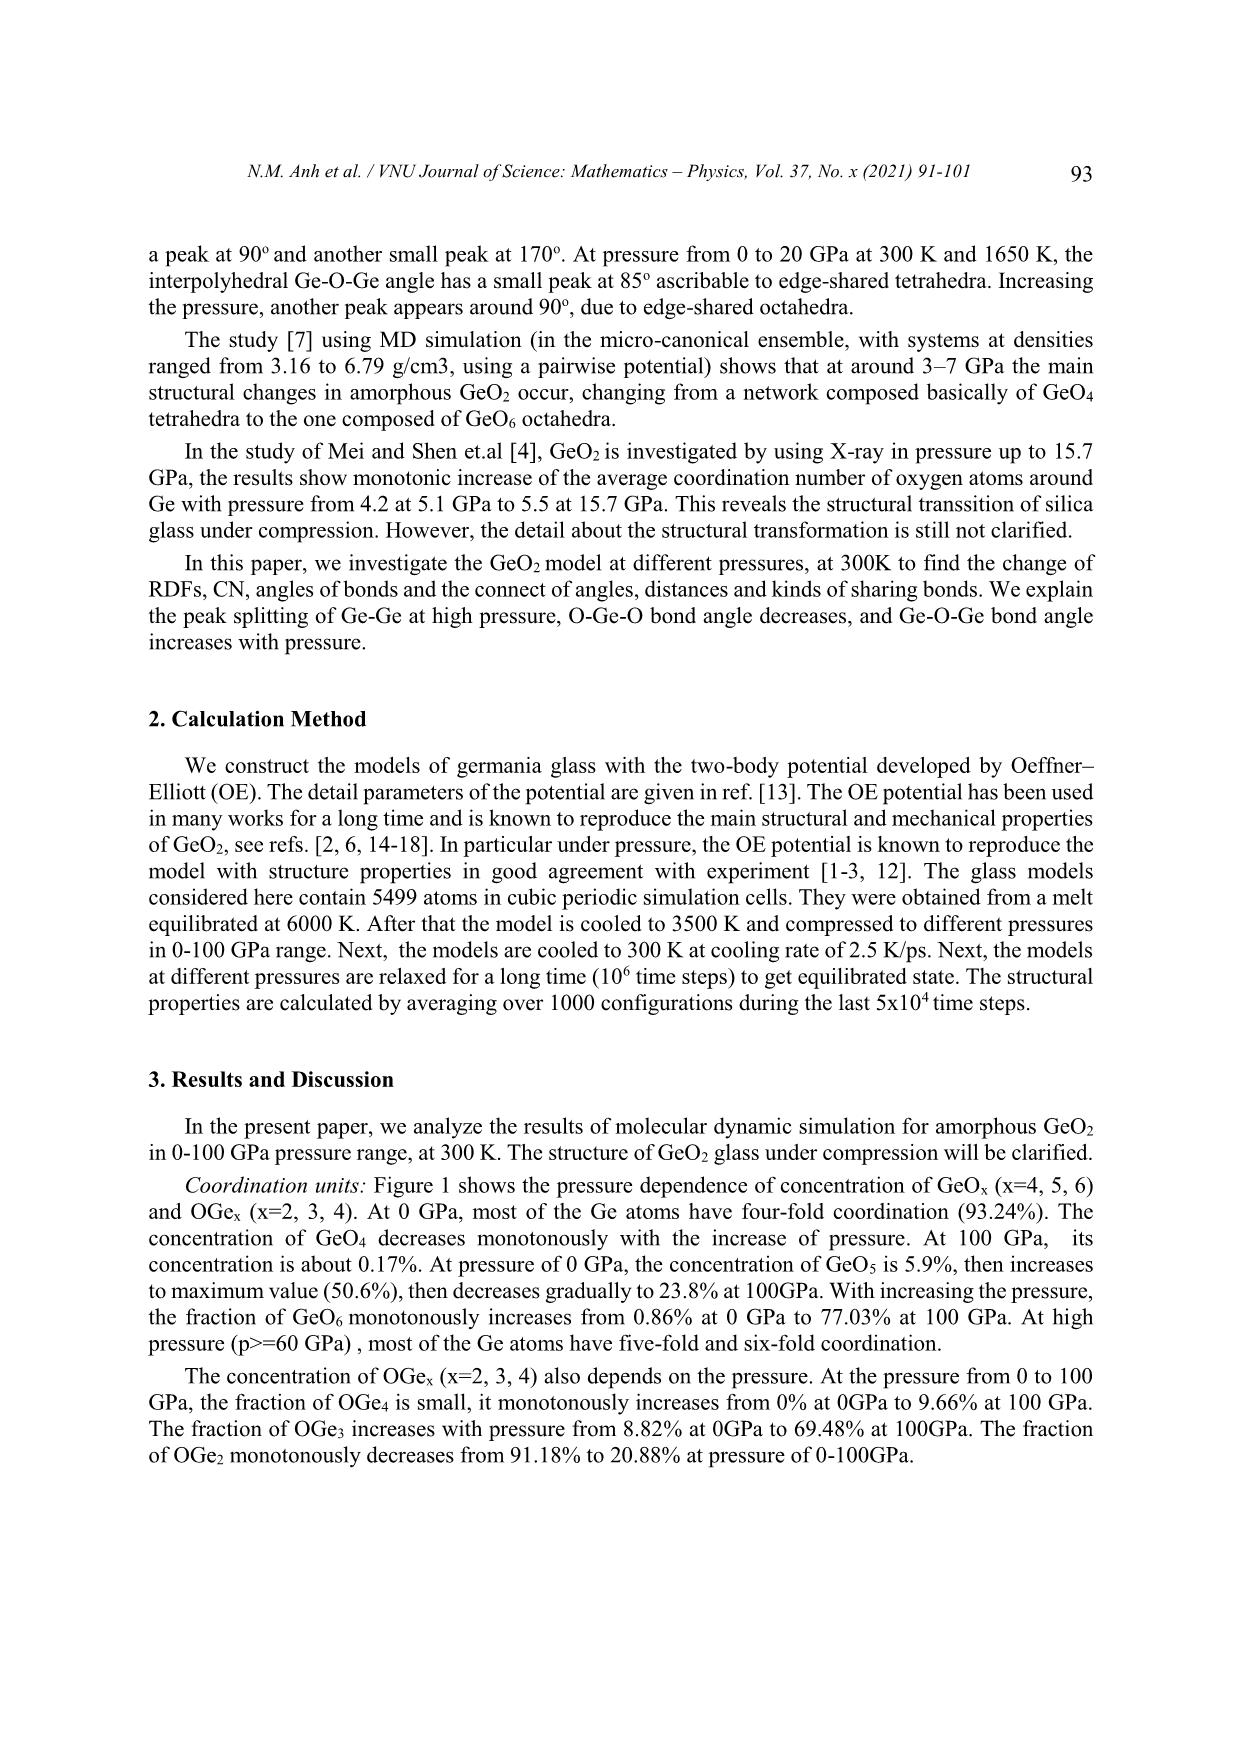
mainly in Ge ... OGe4 at pressure from 30 to 100GPa.
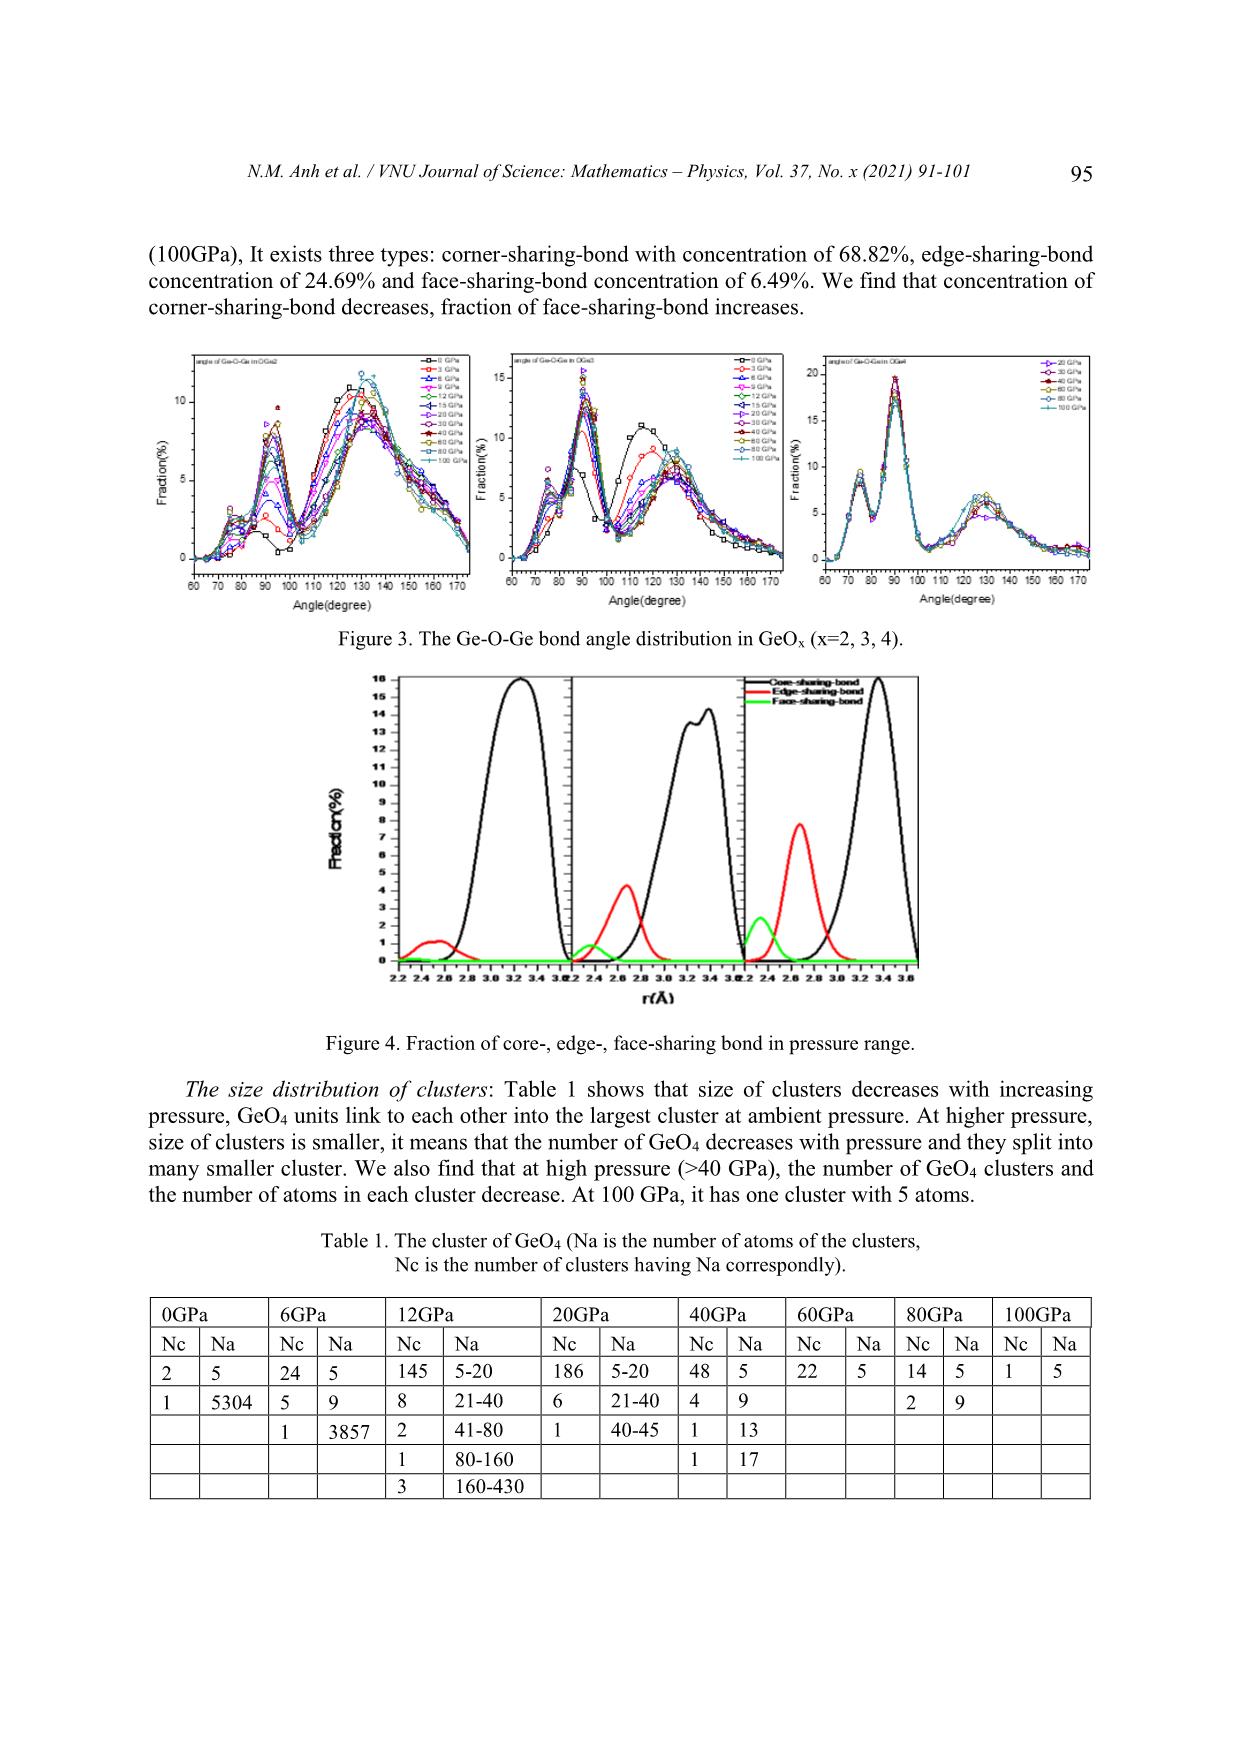
Investigating OGe2 in 0-100GPa range, we find that from 0 to 6 GPa, Ge-O-Ge BAD has two peaks at
 o o o o
around 85 -90 and 125 -130 but in 9-100 GPa range, the Ge-O-Ge BAD of OGe2 has one peak and
two smaller peaks in the left and right at around 75o -80o, 90o-95o and 125o-130o.
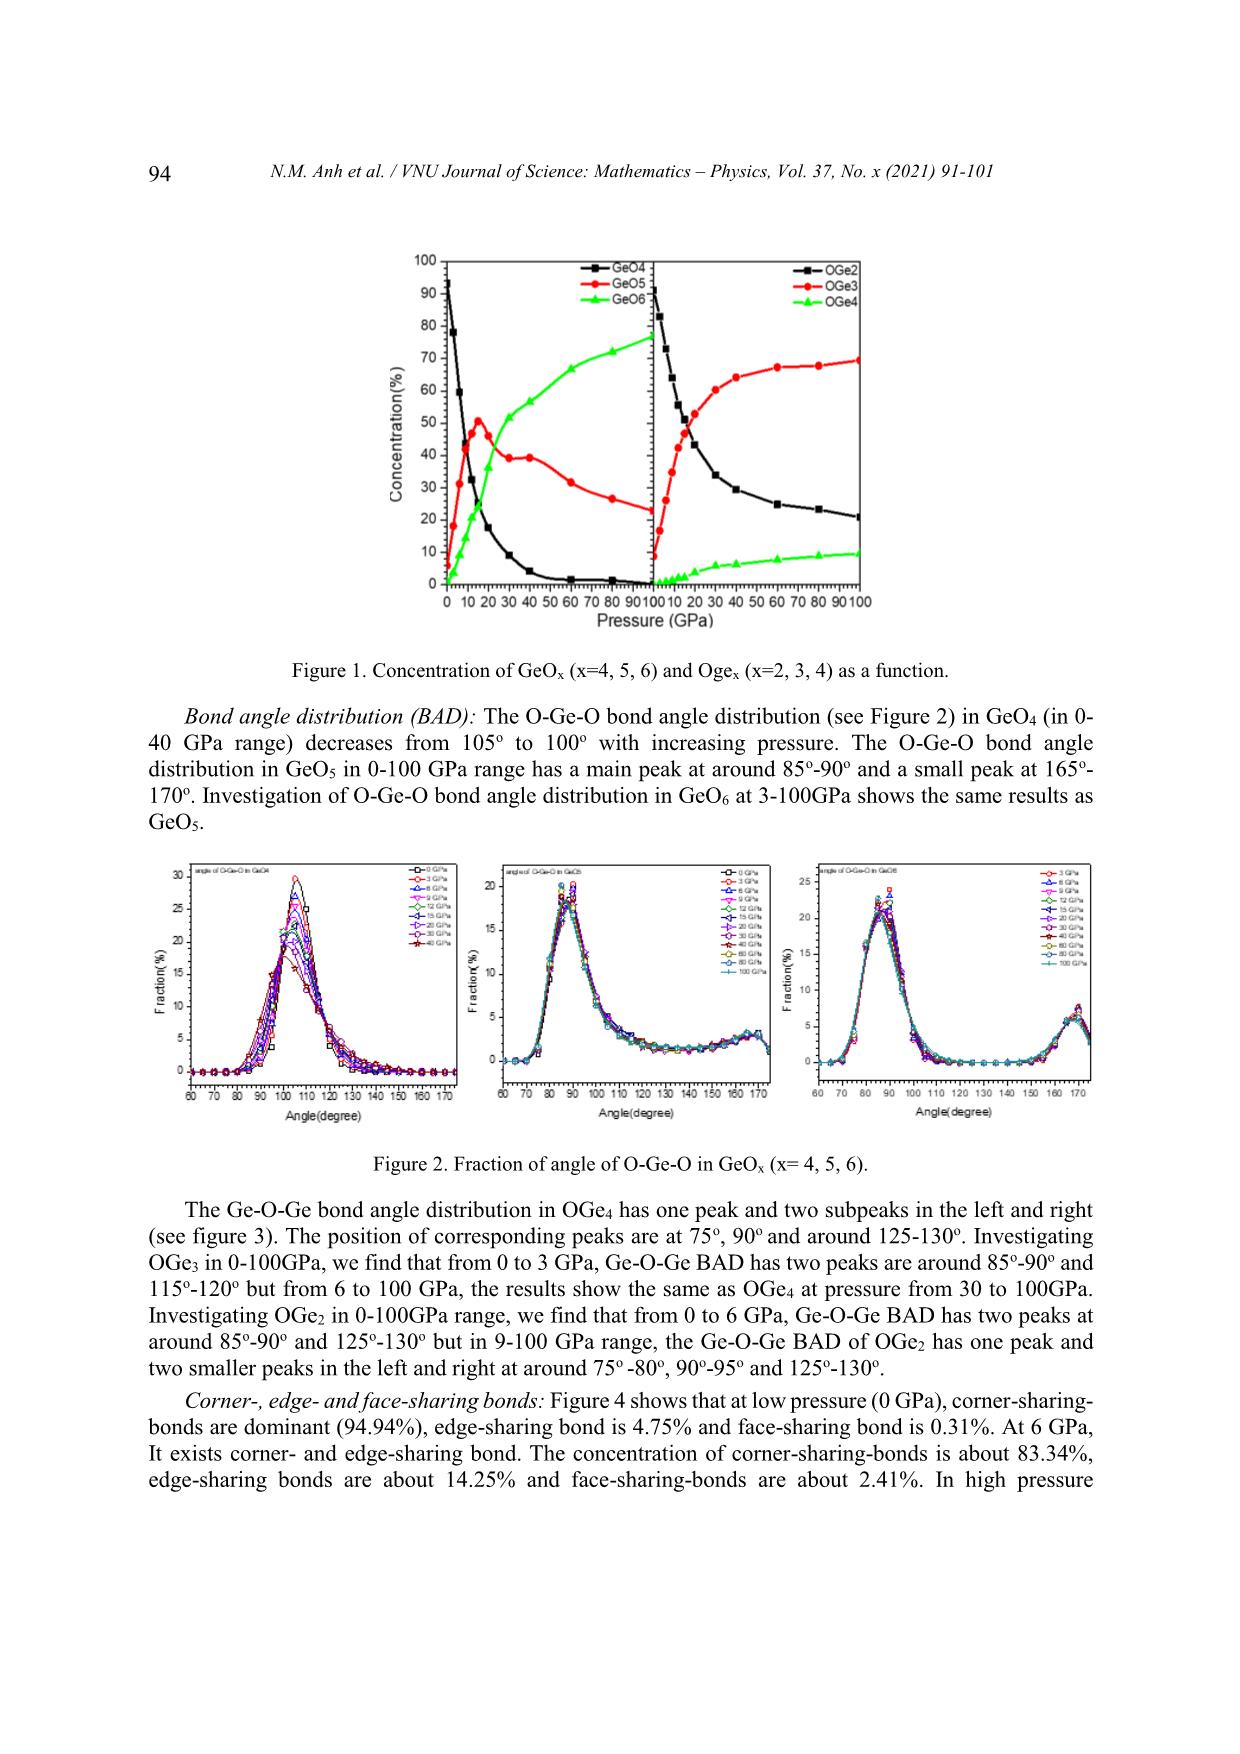
 Corner-, edge- and face-sharing bonds: Figure 4 shows that at low pressure (0 GPa), corner-sharing-
bonds are dominant (94.94%), edge-sharing bond is 4.75% and face-sharing bond is 0.31%. At 6 GPa,
It exists corner- and edge-sharing bond. The concentration of corner-sharing-bonds is about 83.34%,
edge-sharing bonds are about 14.25% and face-sharing-bonds are about 2.41%. In high pressure
 N.M. Anh et al. / VNU Journal of Science: Mathematics – Physics, Vol. 37, No. x (2021) 91-101 95
(100GPa), It exists three types: corner-sharing-bond with concentration of 68.82%, edge-sharing-bond
concentration of 24.69% and face-sharing-bond concentration of 6.49%. We find that concentration of
corner-sharing-bond decreases, fraction of face-sharing-bond increases.
 Figure 3. The Ge-O-Ge bond angle distribution in GeOx (x=2, 3, 4).
 Figure 4. Fraction of core-, edge-, face-sharing bond in pressure range.
 The size distribution of clusters: Table 1 shows that size of clusters decreases with increasing
pressure, GeO4 units link to each other into the largest cluster at ambient pressure. At higher pressure,
size of clusters is smaller, it means that the number of GeO4 decreases with pressure and they split into
many smaller cluster. We also find that at high pressure (>40 GPa), the number of GeO4 clusters and
the number of atoms in each cluster decrease. At 100 GPa, it has one cluster with 5 atoms.
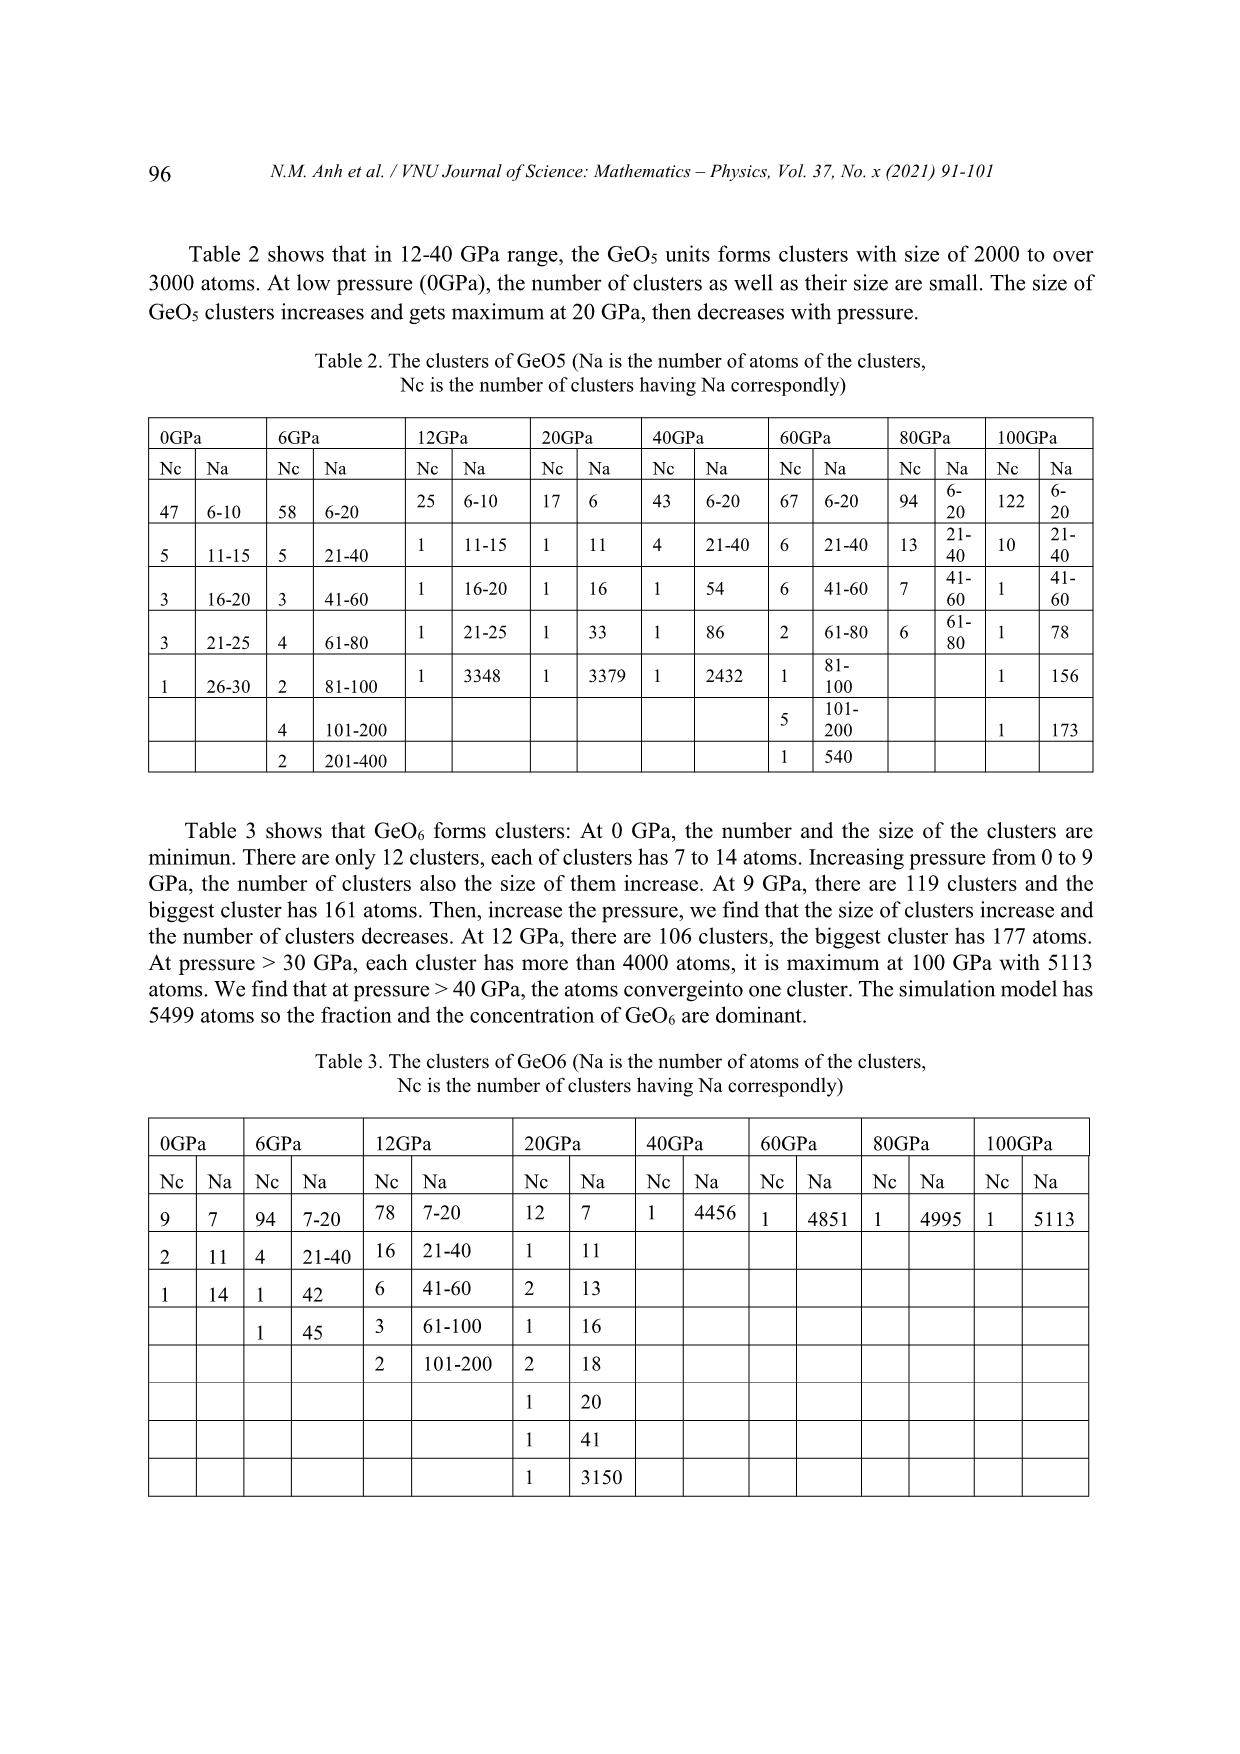
 Table 1. The cluster of GeO4 (Na is the number of atoms of the clusters,
 Nc is the number of clusters having Na correspondly).
 0GPa 6GPa 12GPa 20GPa 40GPa 60GPa 80GPa 100GPa
 Nc Na Nc Na Nc Na Nc Na Nc Na Nc Na Nc Na Nc Na
 2 5 24 5 145 5-20 186 5-20 48 5 22 5 14 5 1 5
 1 5304 5 9 8 21-40 6 21-40 4 9 2 9
 1 3857 2 41-80 1 40-45 1 13
 1 80-160 1 17
 3 160-430
96 N.M. Anh et al. / VNU Journal of Science: Mathematics – Physics, Vol. 37, No. x (2021) 91-101
 Table 2 shows that in 12-40 GPa range, the GeO5 units forms clusters with size of 2000 to over
3000 atoms. At low pressure (0GPa), the number of clusters as well as their size are small. The size of
GeO5 clusters increases and gets maximum at 20 GPa, then decreases with pressure.
 Table 2. The clusters of GeO5 (Na is the number of atoms of the clusters,
 Nc is the number of clusters having Na correspondly)
 0GPa 6GPa 12GPa 20GPa 40GPa 60GPa 80GPa 100GPa
 Nc Na Nc Na Nc Na Nc Na Nc Na Nc Na Nc Na Nc Na
 6- 6-
 25 6-10 17 6 43 6-20 67 6-20 94 122
 47 6-10 58 6-20 20 20
 21- 21-
 1 11-15 1 11 4 21-40 6 21-40 13 10
 5 11-15 5 21-40 40 40
 41- 41-
 1 16-20 1 16 1 54 6 41-60 7 1
 3 16-20 3 41-60 60 60
 61-
 1 21-25 1 33 1 86 2 61-80 6 1 78
 3 21-25 4 61-80 80
 81-
 1 3348 1 3379 1 2432 1 1 156
 1 26-30 2 81-100 100
 101-
 5
 4 101-200 200 1 173
 2 201-400 1 540
 Table 3 shows that GeO6 forms clusters: At 0 GPa, the number and the size of the clusters are
minimun. There are only 12 clusters, each of clusters has 7 to 14 atoms. Increasing pressure from 0 to 9
GPa, the number of clusters also the size of them increase. At 9 GPa, there are 119 clusters and the
biggest cluster has 161 atoms. Then, increase the pressure, we find that the size of clusters increase and
the number of clusters decreases. At 12 GPa, there are 106 clusters, the biggest cluster has 177 atoms.
At pressure > 30 GPa, each cluster has more than 4000 atoms, it is maximum at 100 GPa with 5113
atoms. We find that at pressure > 40 GPa, the atoms convergeinto one cluster. The simulation model has
5499 atoms so the fraction and the concentration of GeO6 are dominant.
 Table 3. The clusters of GeO6 (Na is the number of atoms of the clusters,
 Nc is the number of clusters having Na correspondly)
 0GPa 6GPa 12GPa 20GPa 40GPa 60GPa 80GPa 100GPa
 Nc Na Nc Na Nc Na Nc Na Nc Na Nc Na Nc Na Nc Na
 9 7 94 7-20 78 7-20 12 7 1 4456 1 4851 1 4995 1 5113
 2 11 4 21-40 16 21-40 1 11
 1 14 1 42 6 41-60 2 13
 1 45 3 61-100 1 16
 2 101-200 2 18
 1 20
 1 41
 1 3150
 N.M. Anh et al. / VNU Journal of Science: Mathematics – Physics, Vol. 37, No. x (2021) 91-101 97
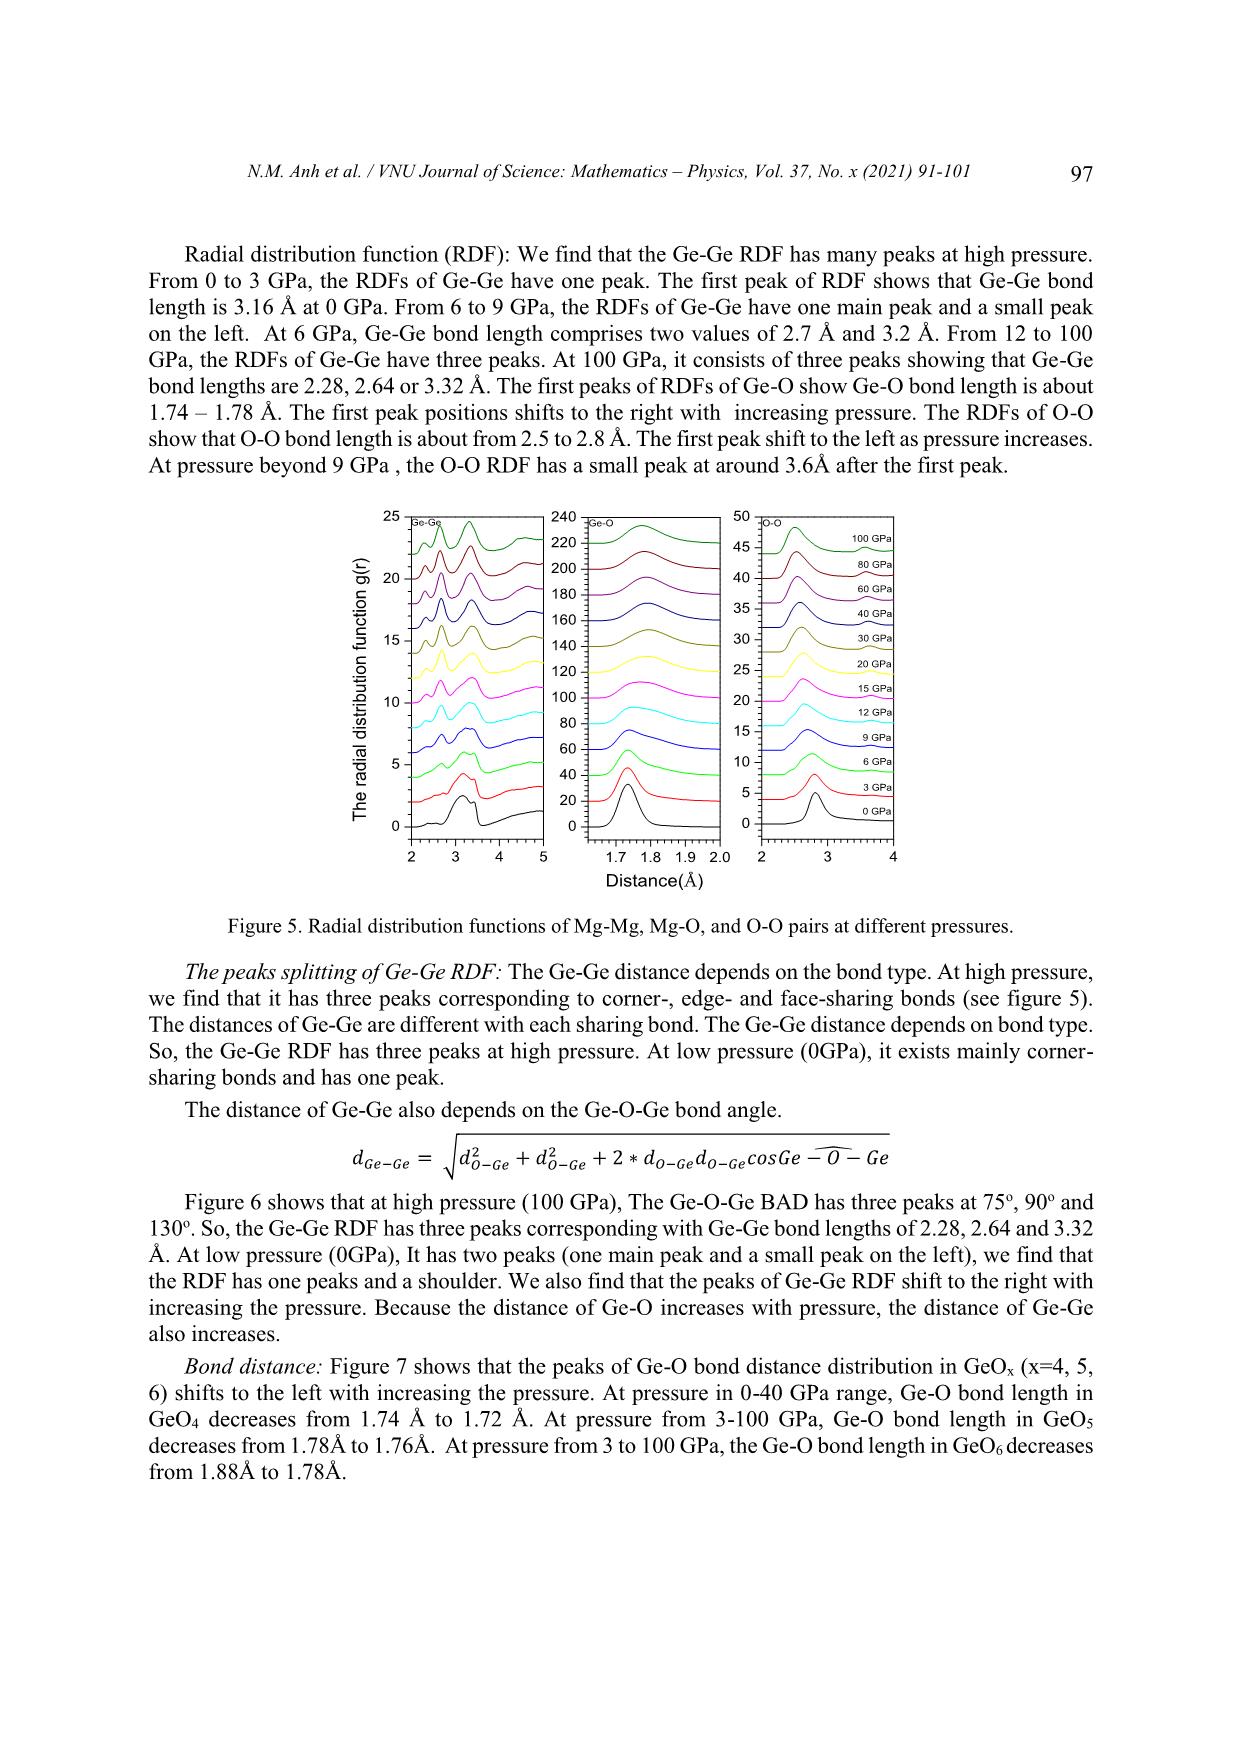
 Radial distribution function (RDF): We find that the Ge-Ge RDF has many peaks at high pressure.
From 0 to 3 GPa, the RDFs of Ge-Ge have one peak. The first peak of RDF shows that Ge-Ge bond
length is 3.16 Å at 0 GPa. From 6 to 9 GPa, the RDFs of Ge-Ge have one main peak and a small peak
on the left. At 6 GPa, Ge-Ge bond length comprises two values of 2.7 Å and 3.2 Å. From 12 to 100
GPa, the RDFs of Ge-Ge have three peaks. At 100 GPa, it consists of three peaks showing that Ge-Ge
bond lengths are 2.28, 2.64 or 3.32 Å. The first peaks of RDFs of Ge-O show Ge-O bond length is about
1.74 – 1.78 Å. The first peak positions shifts to the right with increasing pressure. The RDFs of O-O
show that O-O bond length is about from 2.5 to 2.8 Å. The first peak shift to the left as pressure increases.
At pressure beyond 9 GPa , the O-O RDF has a small peak at around 3.6Å after the first peak.
 25 Ge-Ge 240 Ge-O 50 O-O
 100 GPa
 220 45
 200 80 GPa
 20 40
 180 60 GPa
 35
 160 40 GPa
 30 GPa
 15 140 30
 20 GPa
 120 25
 15 GPa
 10 100 20
 12 GPa
 80
 15 9 GPa
 60
 5 10 6 GPa
 40
 5 3 GPa
 20
 0 GPa
 Thedistributionradialfunction g(r) 0 0 0
 2 3 4 5 1.7 1.8 1.9 2.0 2 3 4
 Distance(Å)
 Figure 5. Radial distribution functions of Mg-Mg, Mg-O, and O-O pairs at different pressures.
 The peaks splitting of Ge-Ge RDF: The Ge-Ge distance depends on the bond type. At high pressure,
we find that it has three peaks corresponding to corner-, edge- and face-sharing bonds (see figure 5).
The distances of Ge-Ge are different with each sharing bond. The Ge-Ge distance depends on bond type.
So, the Ge-Ge RDF has three peaks at high pressure. At low pressure (0GPa), it exists mainly corner-
sharing bonds and has one peak.
 The distance of Ge-Ge also depends on the Ge-O-Ge bond angle.
 2 2 ̂
 푒− 푒 = √ − 푒 + − 푒 + 2 ∗ − 푒 − 푒 표푠 푒 − − 푒
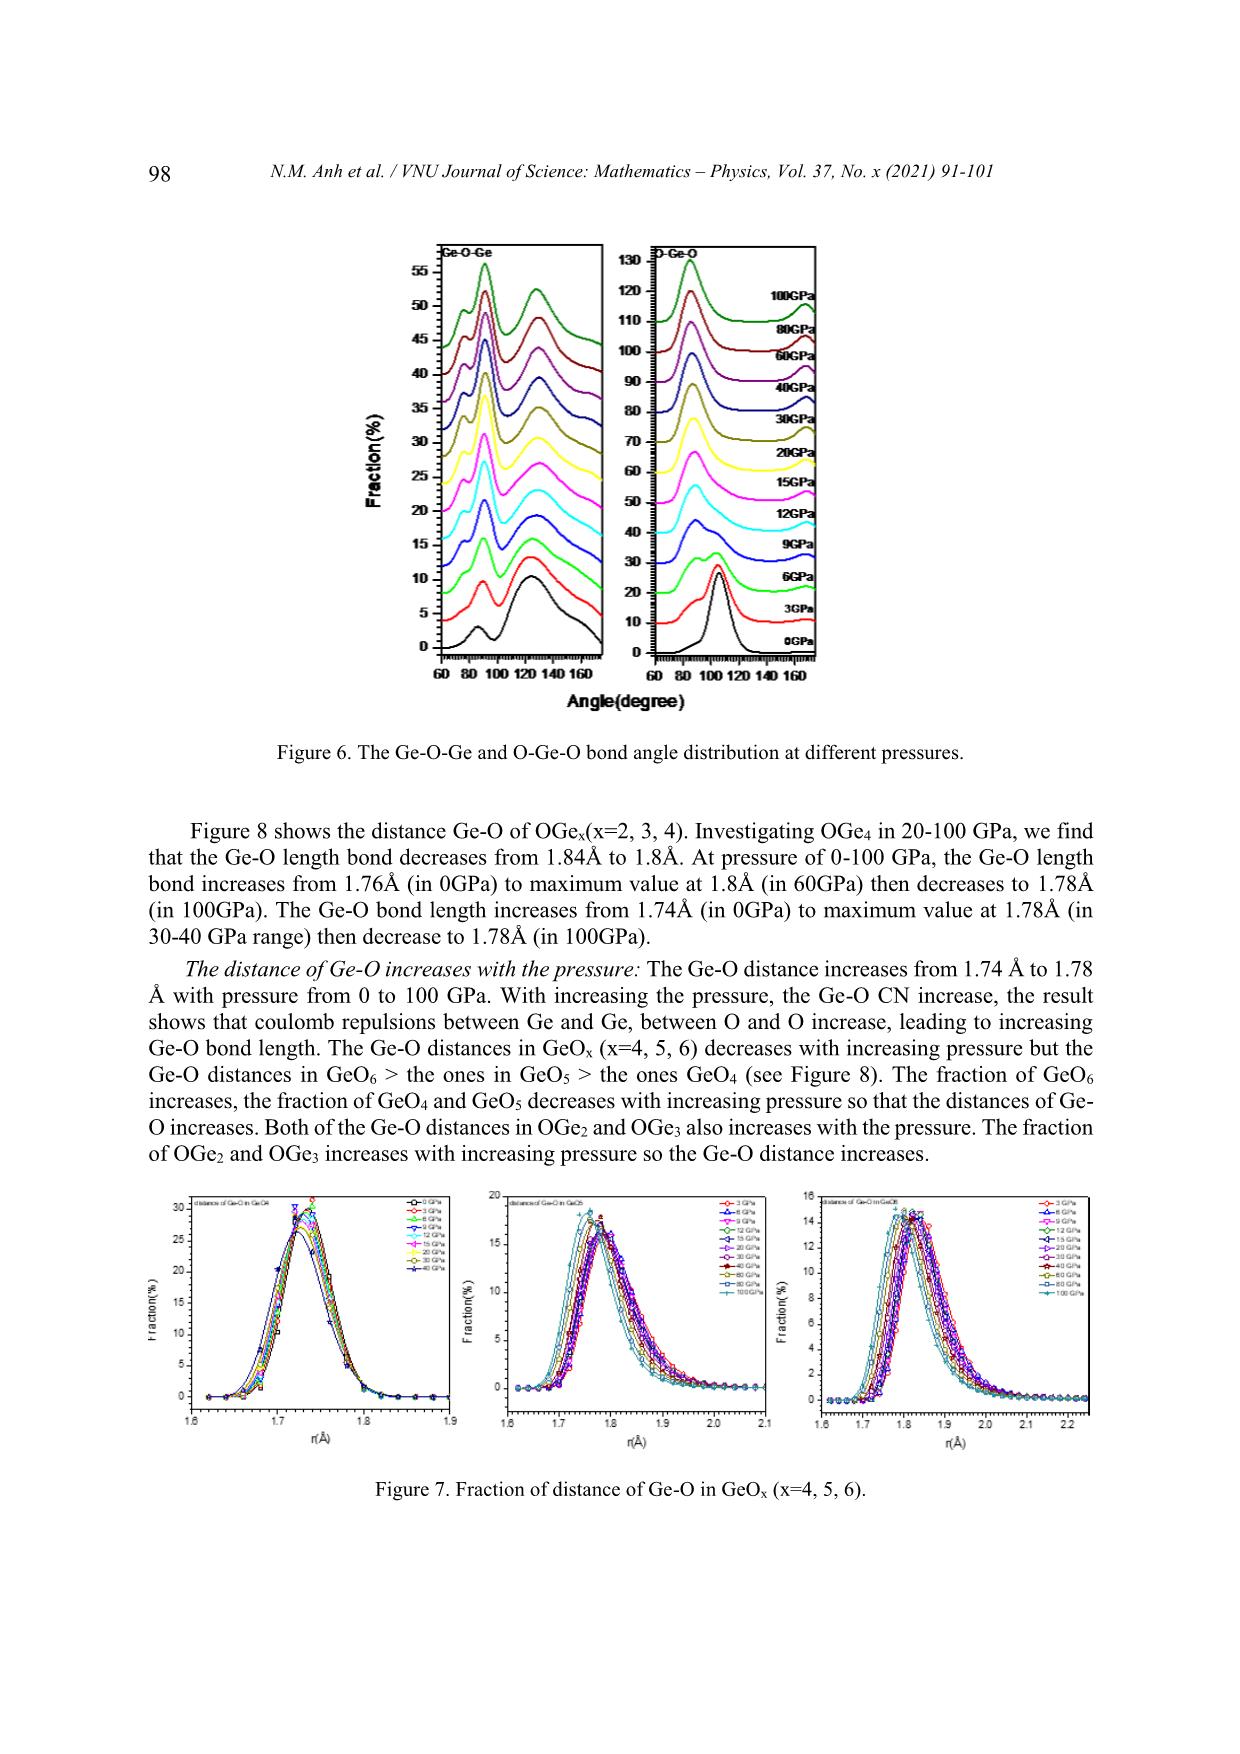
 Figure 6 shows that at high pressure (100 GPa), The Ge-O-Ge BAD has three peaks at 75o, 90o and
130o. So, the Ge-Ge RDF has three peaks corresponding with Ge-Ge bond lengths of 2.28, 2.64 and 3.32
Å. At low pressure (0GPa), It has two peaks (one main peak and a small peak on the left), we find that
the RDF has one peaks and a shoulder. We also find that the peaks of Ge-Ge RDF shift to the right with
increasing the pressure. Because the distance of Ge-O increases with pressure, the distance of Ge-Ge
also increases.
 Bond distance: Figure 7 shows that the peaks of Ge-O bond distance distribution in GeOx (x=4, 5,
6) shifts to the left with increasing the pressure. At pressure in 0-40 GPa range, Ge-O bond length in
GeO4 decreases from 1.74 Å to 1.72 Å. At pressure from 3-100 GPa, Ge-O bond length in GeO5
decreases from 1.78Å to 1.76Å. At pressure from 3 to 100 GPa, the Ge-O bond length in GeO6 decreases
from 1.88Å to 1.78Å.
98 N.M. Anh et al. / VNU Journal of Science: Mathematics – Physics, Vol. 37, No. x (2021) 91-101
 Figure 6. The Ge-O-Ge and O-Ge-O bond angle distribution at different pressures.
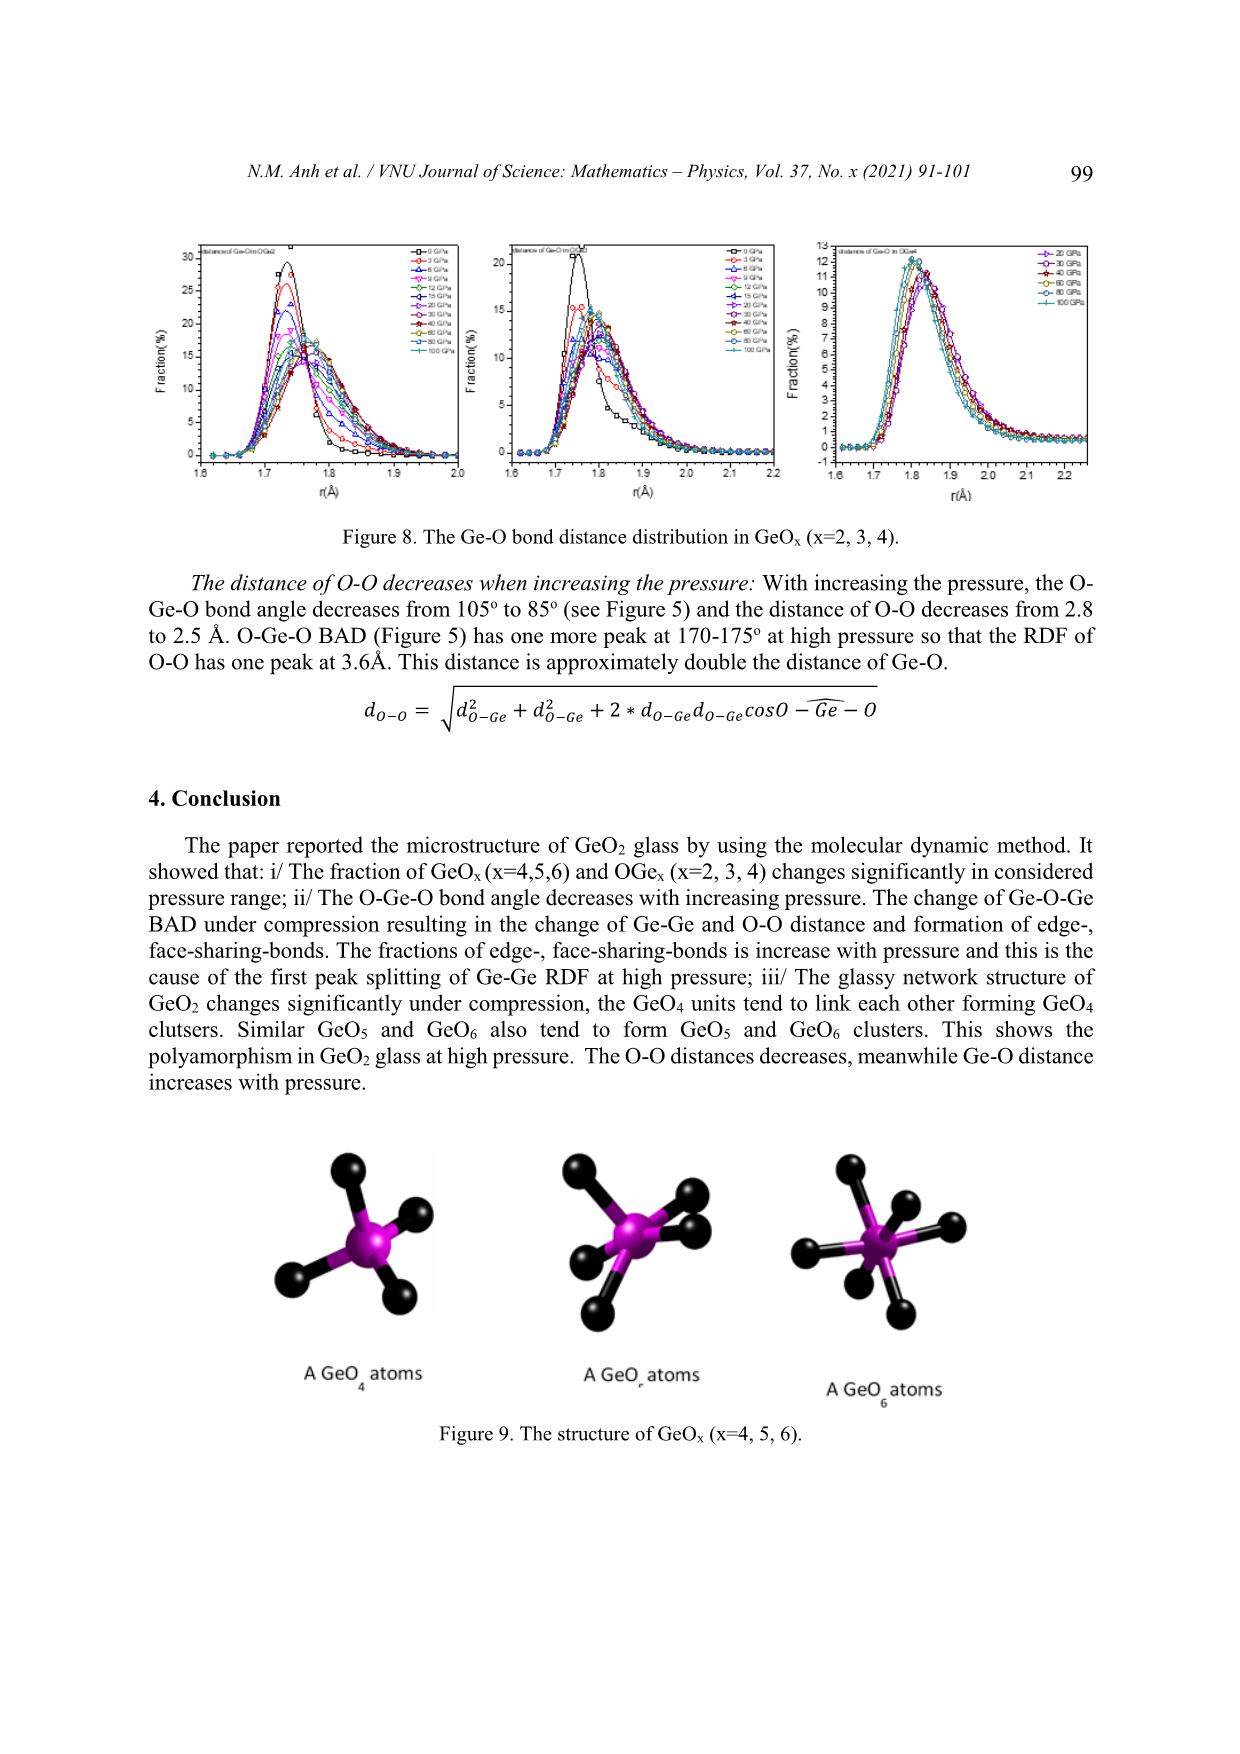
 Figure 8 shows the distance Ge-O of OGex(x=2, 3, 4). Investigating OGe4 in 20-100 GPa, we find
that the Ge-O length bond decreases from 1.84Å to 1.8Å. At pressure of 0-100 GPa, the Ge-O length
bond increases from 1.76Å (in 0GPa) to maximum value at 1.8Å (in 60GPa) then decreases to 1.78Å
(in 100GPa). The Ge-O bond length increases from 1.74Å (in 0GPa) to maximum value at 1.78Å (in
30-40 GPa range) then decrease to 1.78Å (in 100GPa).
 The distance of Ge-O increases with the pressure: The Ge-O distance increases from 1.74 Å to 1.78
Å with pressure from 0 to 100 GPa. With increasing the pressure, the Ge-O CN increase, the result
shows that coulomb repulsions between Ge and Ge, between O and O increase, leading to increasing
Ge-O bond length. The Ge-O distances in GeOx (x=4, 5, 6) decreases with increasing pressure but the
Ge-O distances in GeO6 > the ones in GeO5 > the ones GeO4 (see Figure 8). The fraction of GeO6
increases, the fraction of GeO4 and GeO5 decreases with increasing pressure so that the distances of Ge-
O increases. Both of the Ge-O distances in OGe2 and OGe3 also increases with the pressure. The fraction
of OGe2 and OGe3 increases with increasing pressure so the Ge-O distance increases.
 Figure 7. Fraction of distance of Ge-O in GeOx (x=4, 5, 6).
 N.M. Anh et al. / VNU Journal of Science: Mathematics – Physics, Vol. 37, No. x (2021) 91-101 99
 Figure 8. The Ge-O bond distance distribution in GeOx (x=2, 3, 4).
 The distance of O-O decreases when increasing the pressure: With increasing the pressure, the O-
Ge-O bond angle decreases from 105o to 85o (see Figure 5) and the distance of O-O decreases from 2.8
to 2.5 Å. O-Ge-O BAD (Figure 5) has one more peak at 170-175o at high pressure so that the RDF of
O-O has one peak at 3.6Å. This distance is approximately double the distance of Ge-O.
 2 2 ̂
 − = √ − 푒 + − 푒 + 2 ∗ − 푒 − 푒 표푠 − 푒 −
4. Conclusion
 The paper reported the microstructure of GeO2 glass by using the molecular dynamic method. It
showed that: i/ The fraction of GeOx (x=4,5,6) and OGex (x=2, 3, 4) changes significantly in considered
pressure range; ii/ The O-Ge-O bond angle decreases with increasing pressure. The change of Ge-O-Ge
BAD under compression resulting in the change of Ge-Ge and O-O distance and formation of edge-,
face-sharing-bonds. The fractions of edge-, face-sharing-bonds is increase with pressure and this is the
cause of the first peak splitting of Ge-Ge RDF at high pressure; iii/ The glassy network structure of
GeO2 changes significantly under compression, the GeO4 units tend to link each other forming GeO4
clutsers. Similar GeO5 and GeO6 also tend to form GeO5 and GeO6 clusters. This shows the
polyamorphism in GeO2 glass at high pressure. The O-O distances decreases, meanwhile Ge-O distance
increases with pressure.
 Figure 9. The structure of GeOx (x=4, 5, 6).
100 N.M. Anh et al. / VNU Journal of Science: Mathematics – Physics, Vol. 37, No. x (2021) 91-101
 Figure 10. Linkage between GeOx (x=4, 5, 6) in clusters.
 Figure 11. The structure of core-, edge-, face-sharing bonds.
References
 [1] M. Micoulaut, L. Cormier, G.S. Henderson, The structure of amorphous, crystalline and liquid GeO2, J. Phys.:
 Condens. Matter 18 (2006) R753–R784.
 [2] Dong et.al, Revisiting local structural changes in GeO2 glass at high pressure. Journal of Physics: Condensed Matte
 (2017) 29 465401, https://doi.org/10.1088/1361-648X/aa8d50.
 [3] Yoshio Konoa,Curtis Kenney-Bensona, Daijo Ikutaa, Yuki Shibazakib, Yanbin Wangc, and Guoyin Shena,
 Ultrahigh-pressure polyamorphism in GeO2 glass with coordination number >6. PNAS (2016-03-29) vol 113,
 no.13, 3436–3441 www.pnas.org/lookup/suppl/doi:10. 1073/pnas.1524304113/-/DCSupplementa.
 [4] Q. Mei, S. Sinogeikin, G. Shen, S. Amin, C. J. Benmore, and K. Ding, High-pressure x-ray diffraction
 measurements on vitreous GeO2 under hydrostatic conditions. Physical review. B 81, 174113 (2010),
 https://doi.org/10.1103/PhysRevB.81.174113.
 [5] Tran Thuy Duong, Toshiaki Iitaka, Pham Khac Hung, Nguyen Van Hong, The first peak splitting of the Ge-Ge pair
 RDF in the correlation tonetwork structure of GeO2 under compression. Journal of Non-Crystalline Solids 459
 (2017) 103–110, https://doi.org/10.1016/j.jnoncrysol.2017.01.003.
 [6] Shanavas et.al, Classical molecular dynamics simulations behavior of GeO2 under high pressures and at high
 temperatures, Phys. Rev. B 73 (2006), 094120 https://doi.org/10.1103/PhysRevB.73.094120.
 [7] Joaquín Peralta, Gonzalo Gutiérrez, Pressure-induced structural transition in amorphous GeO2: a molecular
 dynamics simulation. Eur. Phys. J. B 87, 257 (2014) , https://doi.org/10.1140/epjb/e2014-50176-3.
 [8] C. Sevik, C. Bulutay, J. Mater. Theoretical study of the insulating oxides and nitrides: SiO2, GeO2, Al2O3, Si3N4,
 and Ge3N4, Sci. 42 (2007) 6555–6565, https://doi.org/10.1007/s10853-007-1526-9.
 [9] Q.J. Liu, Z.T. Liu, L.P. Feng, H. Tian, First-principles study of structural, elastic, electronic and optical properties
 of rutile GeO2 and alpha-quartz GeO2 Solid State Sciences 12 (2010) 1748–1755,
 https://doi.org/10.1016/j.solidstatesciences.2010.07.025.
 N.M. Anh et al. / VNU Journal of Science: Mathematics – Physics, Vol. 37, No. x (2021) 91-101 101
[10] Z. Lodziana, K. Parlinski, J. Hafner, Ab-initio studies of high-pressure phase-transitions in GeO2, Phys. Rev. B 63
 (2001) 134106, https://doi.org/10.1103/PhysRevB.63.134106.
[11] M Vaccari, G Aquilanti, S Pascarelli and O Mathon, A new EXAFS investigation of local structural changes in
 amorphous and crystalline GeO2 at high pressure. J. Phys.: Condens. Matter 21 (2009) 145403 (8pp),
 https://doi.org/10.1088/0953-8984/21/14/145403.
[12] Salmon et.al, Erratum: Density-driven structural transformations in network forming glasses: a high-pressure
 neutron diffraction study of GeO2 glass up to 17.5 GPa. IOPscience. Journal of Physics: Condensed Matte 24
 (2012) 439601 (1pp), https://doi.org/10.1088/0953-8984/18/45/R01.
[13] R.D. Oeffner, S.R. Elliott, Interatomic potential for germanium dioxide empirically fitted to an ab-initio energy
 surface, Phys. Rev. B 58 (22) (1998) 14791–14803, https://doi.org/10.1103/PhysRevB.58.14791.
[14] J. Peralta, G. Guti ́errez, and J. Rogan. Structural and vibrational properties of amorphous GeO2: a molecular
 dynamics study. J. Phys.: Condens. Matter, 20(14):145215, 2008, https://doi.org/10.1088/0953-8984/20/14/145215
[15] P.K. Hung, L.T. Vinh, N.T. Nhan, N.V. Hong, and T.V. Mung. Local structure of liquids Al2O3 and GeO2 under
 densification. J. Non-Cryst. Solids, 354:3093–3097, 2008. https://doi.org/10.1016/j.jnoncrysol.2008.01.010.
[16] T. Li, S. Huang, and J. Zhu. The structure and void analysis of pressure-induced amorphous GeO2: Molecular
 dynamics simulation.Chem. Phys. Lett., 471 (4–6): 253–257, 2009.  10.1016/j.cplett.2009.02.059.
[17] M. Hawlitzky, J. Horbach, S. Ispas, M. Krack, and K. Binder. Comparative classical and ab initio molecular
 dynamics study of molten and glassy germanium dioxide. J. Phys.: Condens. Matter, 20 (28):285106, 2008,
 https://doi.org/10.1088/0953-8984/20/28/285106.
[18] D. Marrocchelli, M. Salanne, P.A. Madden, C. Simon, and P. Turq.The construction of a reliable potential for GeO2
 from first principles. Mol. Phys., 107(4–6):443–452, 2009, https://doi.org/10.1080/00268970902845347.
File đính kèm:
 structure_of_geo_glass_under_compression_using_molecular_dyn.pdf

