Risk attitude and corporate investment under output market uncertainty: Evidence from the Me Kong river delta, Viet Nam
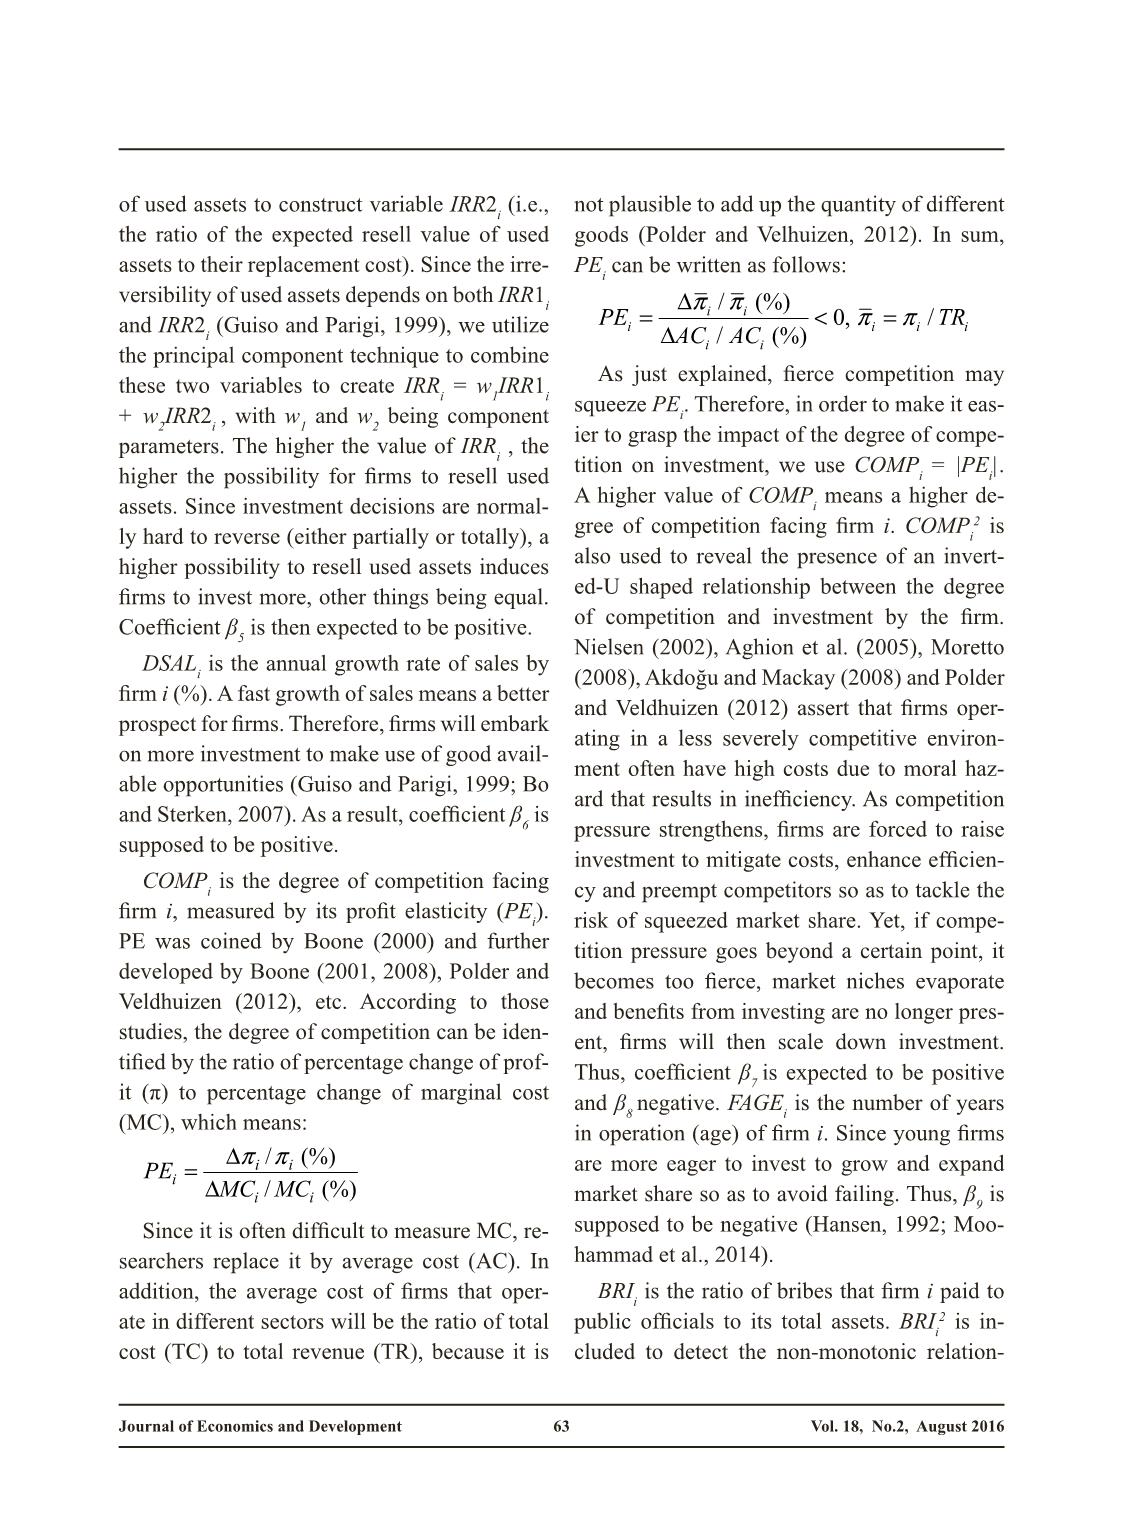
Investment is crucial to the development of
firms since it helps enhance product quality and
increase market share. Thus, good investment
decisions will raise firms’ efficiency and then
trigger economic growth (Maki et al., 2005).
However, making right investment decisions is
basically difficult, due to the output market uncertainty facing firm managers, among others
(e.g., competition and financing constraints).
As well perceived, investment decisions are
much dependent on firm managers’ risk attitude toward output market uncertainty (Bo and
Sterken, 2007; Femminis, 2008). Being skeptical about the loss that may result from poor investment decisions, risk-averse managers tend
to postpone investment intents so as to acquire
more relevant information. In this situation,
they possibly forgo good investment opportunities. On the other hand, risk-loving managers
who are normally over-optimistic about their
own competence and market prospect will proceed with investment opportunities, irrespective of their uncertain outcomes. This tendency
is accentuated by successes in the past. Such
over-optimistic behaviour may be problematic
if output markets would somehow turn worse.
Thus, investment decisions of both risk-averse
and risk-loving managers seem to have drawbacks that should be avoided.
The aim of this paper is to examine the impact of managers’ risk attitude on investment
by non-state firms in the Mekong River Delta (MRD) under output market uncertainty.
Findings of this paper will lay down a credible
ground for recommendations that enable firms
to make better investment decisions and proper long-term business strategies. This paper is
structured as follows. Section 1 introduces the
paper. Section 2 gives a review of the related
literature. Section 3 defines the empirical model out of the literature reviewed. Section 4 discusses the findings using a set of primary data
on 667 non-state firms in the MRD. Section 6
concludes the paper and renders recommendations.
Trang 1
Trang 2
Trang 3
Trang 4
Trang 5
Trang 6
Trang 7
Trang 8
Trang 9
Trang 10
Tải về để xem bản đầy đủ
Tóm tắt nội dung tài liệu: Risk attitude and corporate investment under output market uncertainty: Evidence from the Me Kong river delta, Viet Nam
Journal of Economics and Development Vol. 18, No.2, August 201659
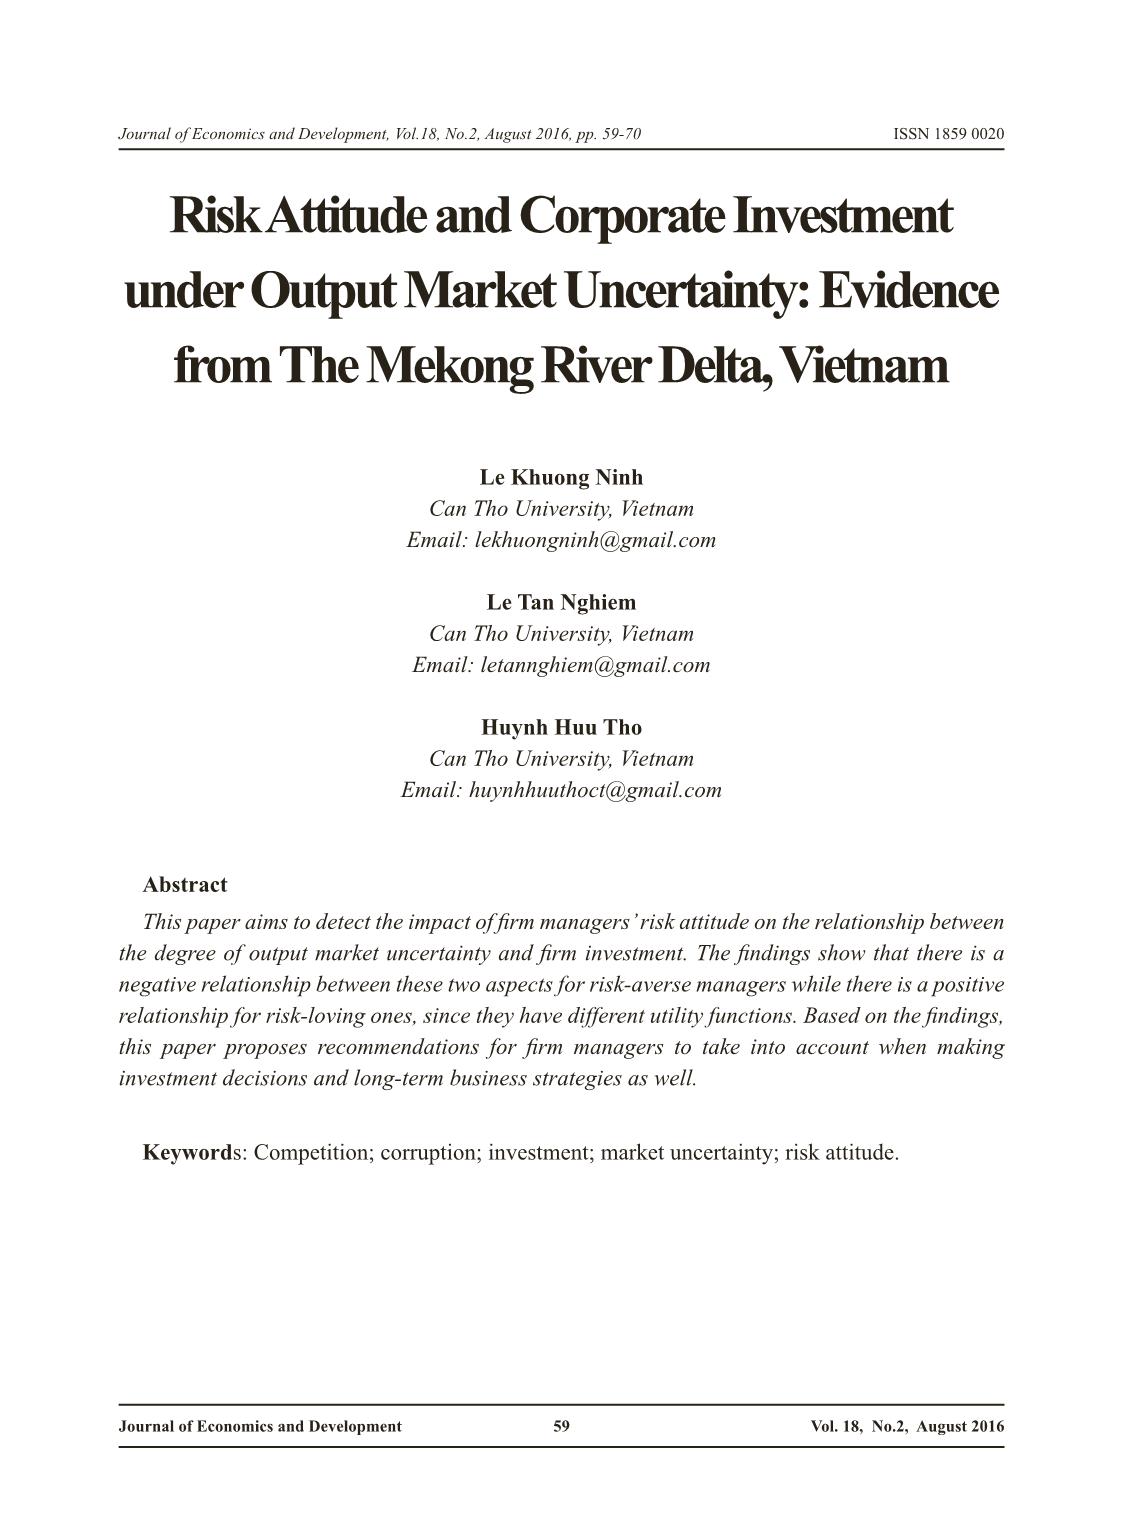
Journal of Economics and Development, Vol.18, No.2, August 2016, pp. 59-70 ISSN 1859 0020
Risk Attitude and Corporate Investment
under Output Market Uncertainty: Evidence
from The Mekong River Delta, Vietnam
Le Khuong Ninh
Can Tho University, Vietnam
Email: lekhuongninh@gmail.com
Le Tan Nghiem
Can Tho University, Vietnam
Email: letannghiem@gmail.com
Huynh Huu Tho
Can Tho University, Vietnam
Email: huynhhuuthoct@gmail.com
Abstract
This paper aims to detect the impact of firm managers’ risk attitude on the relationship between
the degree of output market uncertainty and firm investment. The findings show that there is a
negative relationship between these two aspects for risk-averse managers while there is a positive
relationship for risk-loving ones, since they have different utility functions. Based on the findings,
this paper proposes recommendations for firm managers to take into account when making
investment decisions and long-term business strategies as well.
Keywords: Competition; corruption; investment; market uncertainty; risk attitude.
Journal of Economics and Development Vol. 18, No.2, August 201660
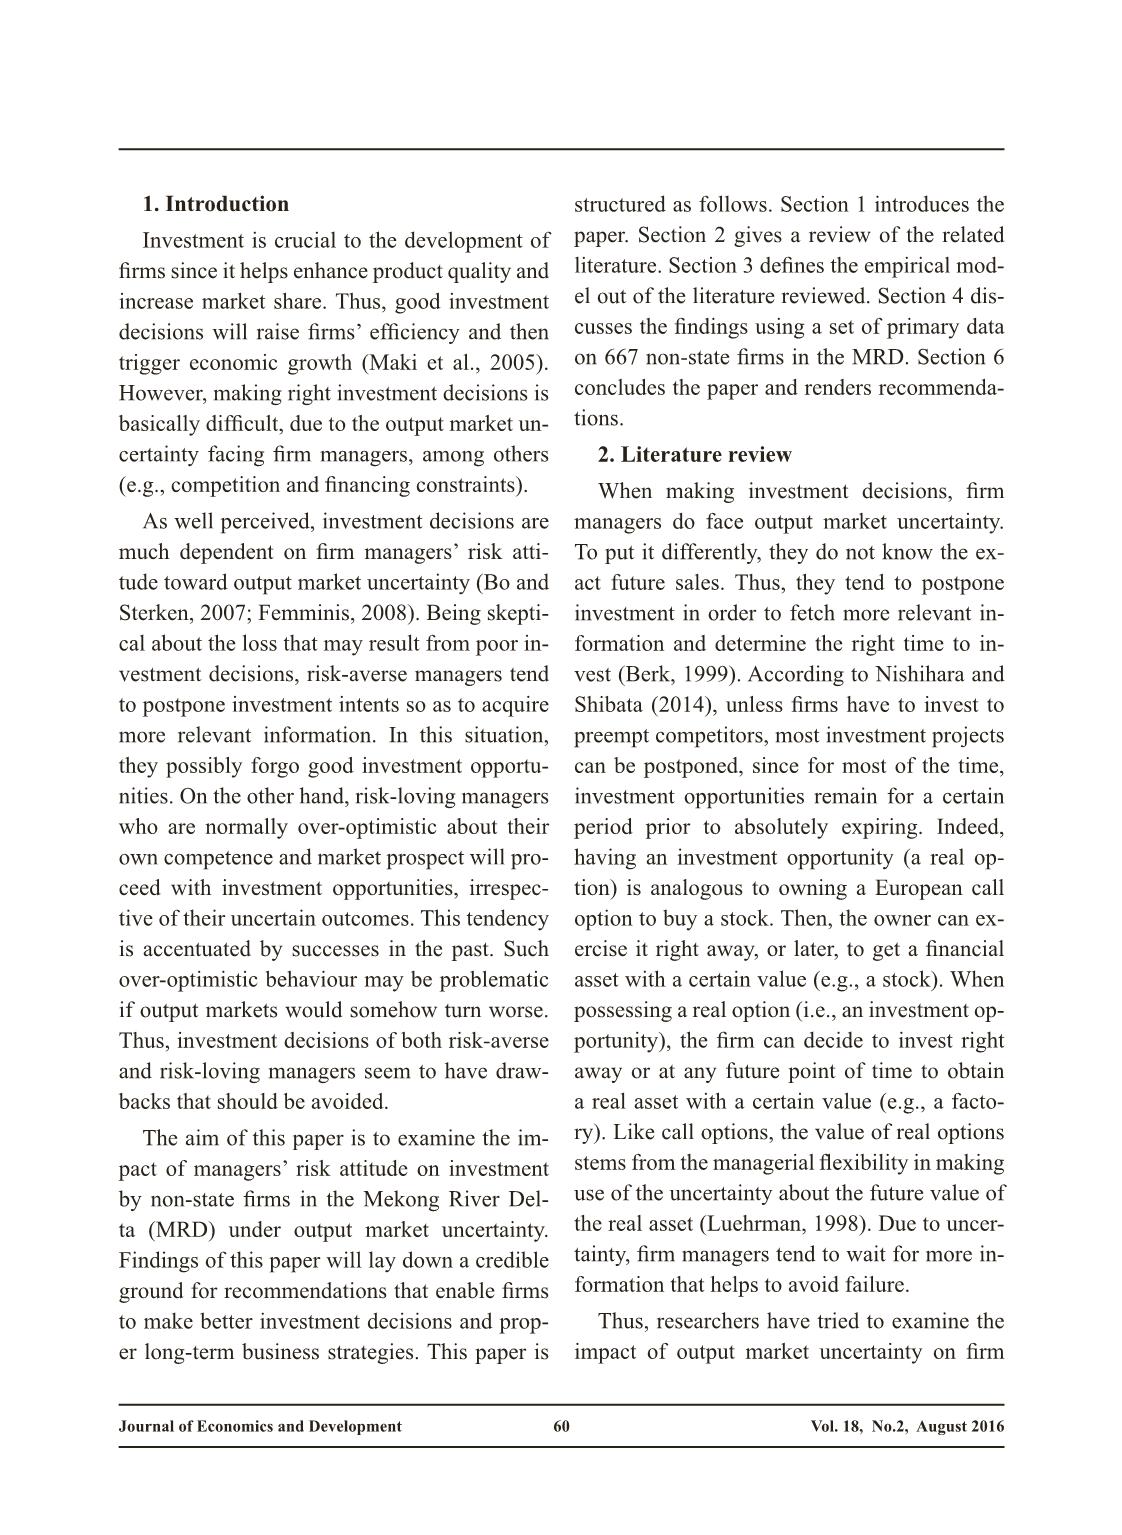
1. Introduction
Investment is crucial to the development of
firms since it helps enhance product quality and
increase market share. Thus, good investment
decisions will raise firms’ efficiency and then
trigger economic growth (Maki et al., 2005).
However, making right investment decisions is
basically difficult, due to the output market un-
certainty facing firm managers, among others
(e.g., competition and financing constraints).
As well perceived, investment decisions are
much dependent on firm managers’ risk atti-
tude toward output market uncertainty (Bo and
Sterken, 2007; Femminis, 2008). Being skepti-
cal about the loss that may result from poor in-
vestment decisions, risk-averse managers tend
to postpone investment intents so as to acquire
more relevant information. In this situation,
they possibly forgo good investment opportu-
nities. On the other hand, risk-loving managers
who are normally over-optimistic about their
own competence and market prospect will pro-
ceed with investment opportunities, irrespec-
tive of their uncertain outcomes. This tendency
is accentuated by successes in the past. Such
over-optimistic behaviour may be problematic
if output markets would somehow turn worse.
Thus, investment decisions of both risk-averse
and risk-loving managers seem to have draw-
backs that should be avoided.
The aim of this paper is to examine the im-
pact of managers’ risk attitude on investment
by non-state firms in the Mekong River Del-
ta (MRD) under output market uncertainty.
Findings of this paper will lay down a credible
ground for recommendations that enable firms
to make better investment decisions and prop-
er long-term business strategies. This paper is
structured as follows. Section 1 introduces the
paper. Section 2 gives a review of the related
literature. Section 3 defines the empirical mod-
el out of the literature reviewed. Section 4 dis-
cusses the findings using a set of primary data
on 667 non-state firms in the MRD. Section 6
concludes the paper and renders recommenda-
tions.
2. Literature review
When making investment decisions, firm
managers do face output market uncertainty.
To put it differently, they do not know the ex-
act future sales. Thus, they tend to postpone
investment in order to fetch more relevant in-
formation and determine the right time to in-
vest (Berk, 1999). According to Nishihara and
Shibata (2014), unless firms have to invest to
preempt competitors, most investment projects
can be postponed, since for most of the time,
investment opportunities remain for a certain
period prior to absolutely expiring. Indeed,
having an investment opportunity (a real op-
tion) is analogous to owning a European call
option to buy a stock. Then, the owner can ex-
ercise it right away, or later, to get a financial
asset with a certain value (e.g., a stock). When
possessing a real option (i.e., an investment op-
portunity), the firm can decide to invest right
away or at any future point of time to obtain
a real asset with a certain value (e.g., a facto-
ry). Like call options, the value of real options
stems from the managerial flexibility in making
use of the uncertainty about the future value of
the real asset (Luehrman, 1998). Due to uncer-
tainty, firm managers tend to wait for more in-
formation that helps to avoid failure.
Thus, researchers have tried to examine the
impact of output market uncertainty on firm
Journal of Economics and Development Vol. 18, No.2, August 201661
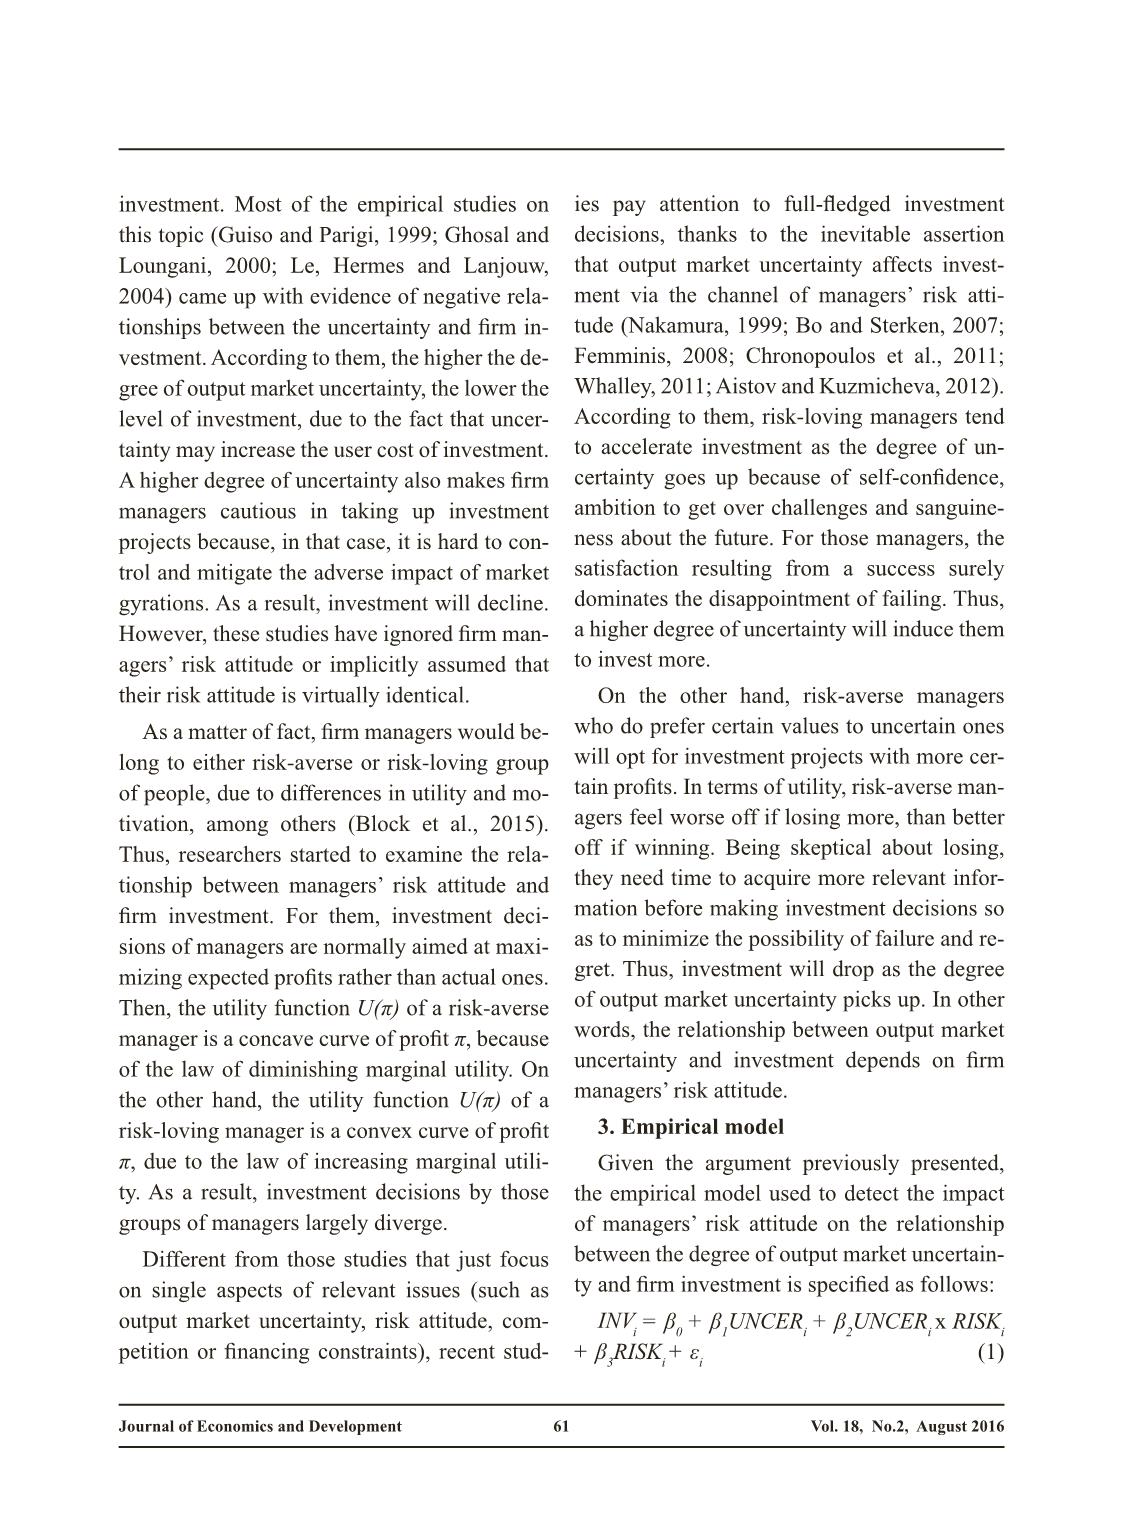
investment. Most of the empirical studies on
this topic (Guiso and Parigi, 1999; Ghosal and
Loungani, 2000; Le, Hermes and Lanjouw,
2004) came up with evidence of negative rel ... cteristics of the surveyed firms
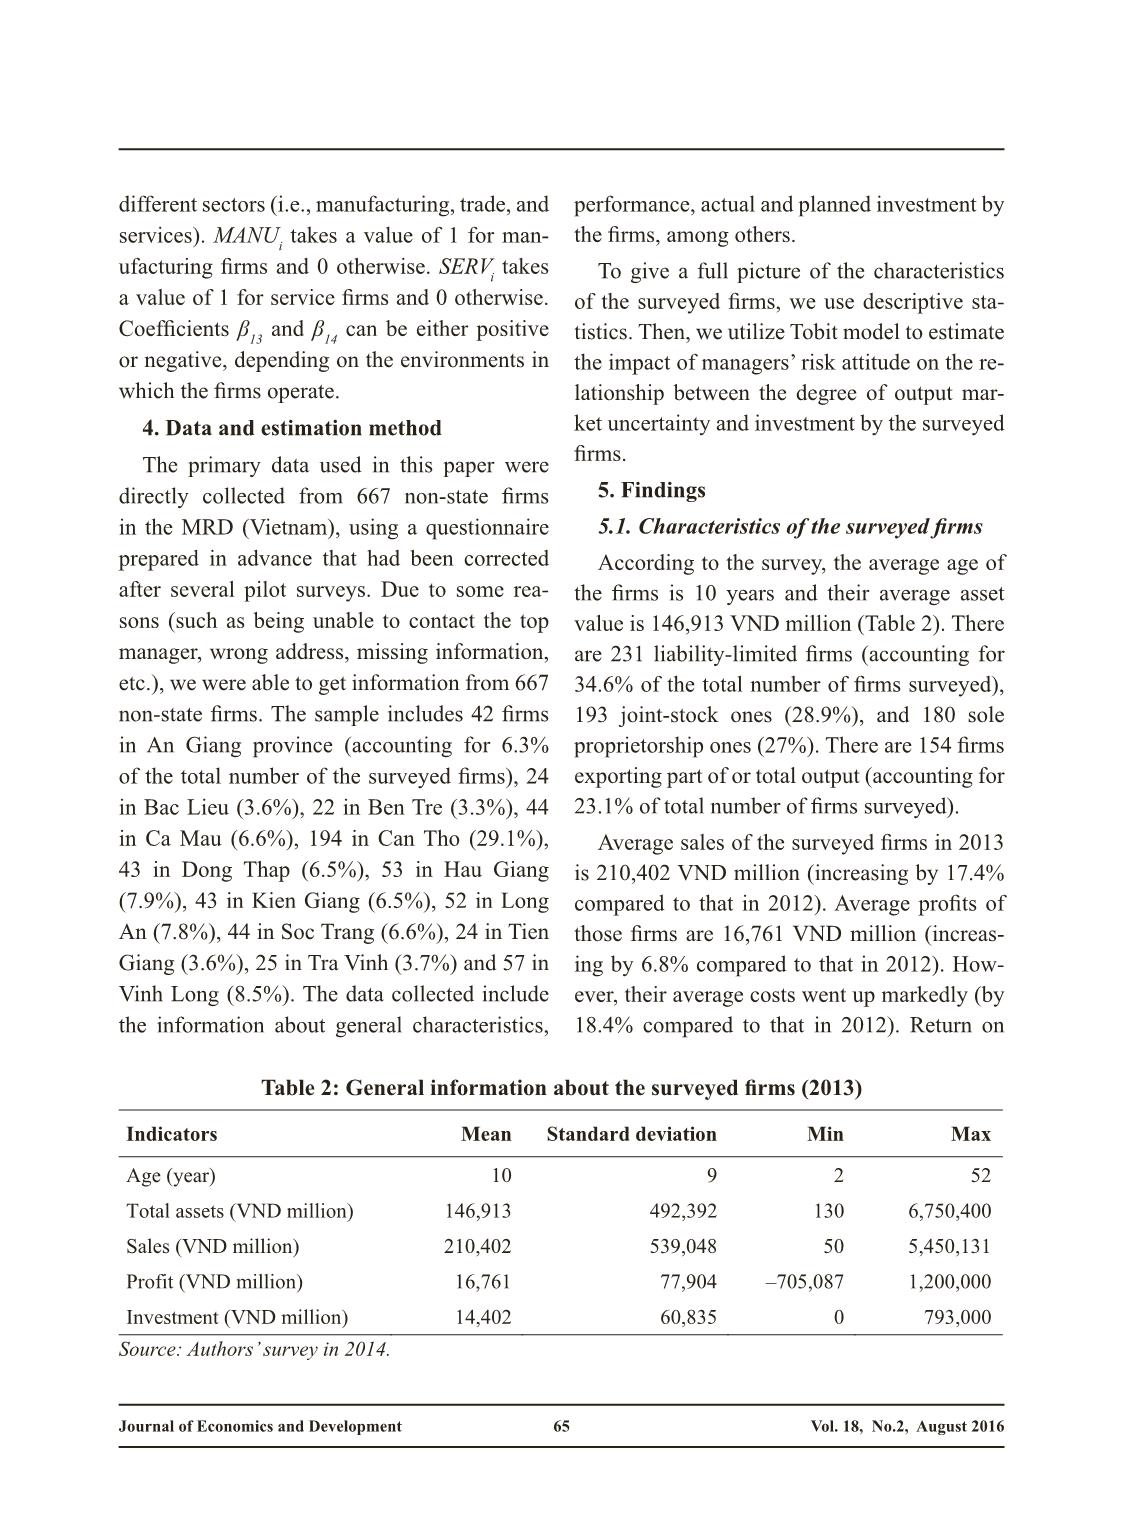
According to the survey, the average age of
the firms is 10 years and their average asset
value is 146,913 VND million (Table 2). There
are 231 liability-limited firms (accounting for
34.6% of the total number of firms surveyed),
193 joint-stock ones (28.9%), and 180 sole
proprietorship ones (27%). There are 154 firms
exporting part of or total output (accounting for
23.1% of total number of firms surveyed).
Average sales of the surveyed firms in 2013
is 210,402 VND million (increasing by 17.4%
compared to that in 2012). Average profits of
those firms are 16,761 VND million (increas-
ing by 6.8% compared to that in 2012). How-
ever, their average costs went up markedly (by
18.4% compared to that in 2012). Return on
Table 2: General information about the surveyed firms (2013)
Source: Authors’ survey in 2014.
Indicators Mean Standard deviation Min Max
Age (year) 10 9 2 52
Total assets (VND million) 146,913 492,392 130 6,750,400
Sales (VND million) 210,402 539,048 50 5,450,131
Profit (VND million) 16,761 77,904 –705,087 1,200,000
Investment (VND million) 14,402 60,835 0 793,000
Journal of Economics and Development Vol. 18, No.2, August 201666
sales (ROS) of those firms was 8%. All this im-
plies that the firms had reasonable growth rates
but did not well utilize resources, so the costs
are high.
About 46.3% of the surveyed firms paid
bribes and the average bribe per firm is 192.2
VND million per year. Bribing seems to be per-
vasive as 45.6% of the firms did it on purpose
to get things done faster and 48.5% saw it as
an implicit norm. The firms bribed by giving
gifts (accounting for 56.0% of total number of
firms), travel (54.3%) or in cash (52.8%).
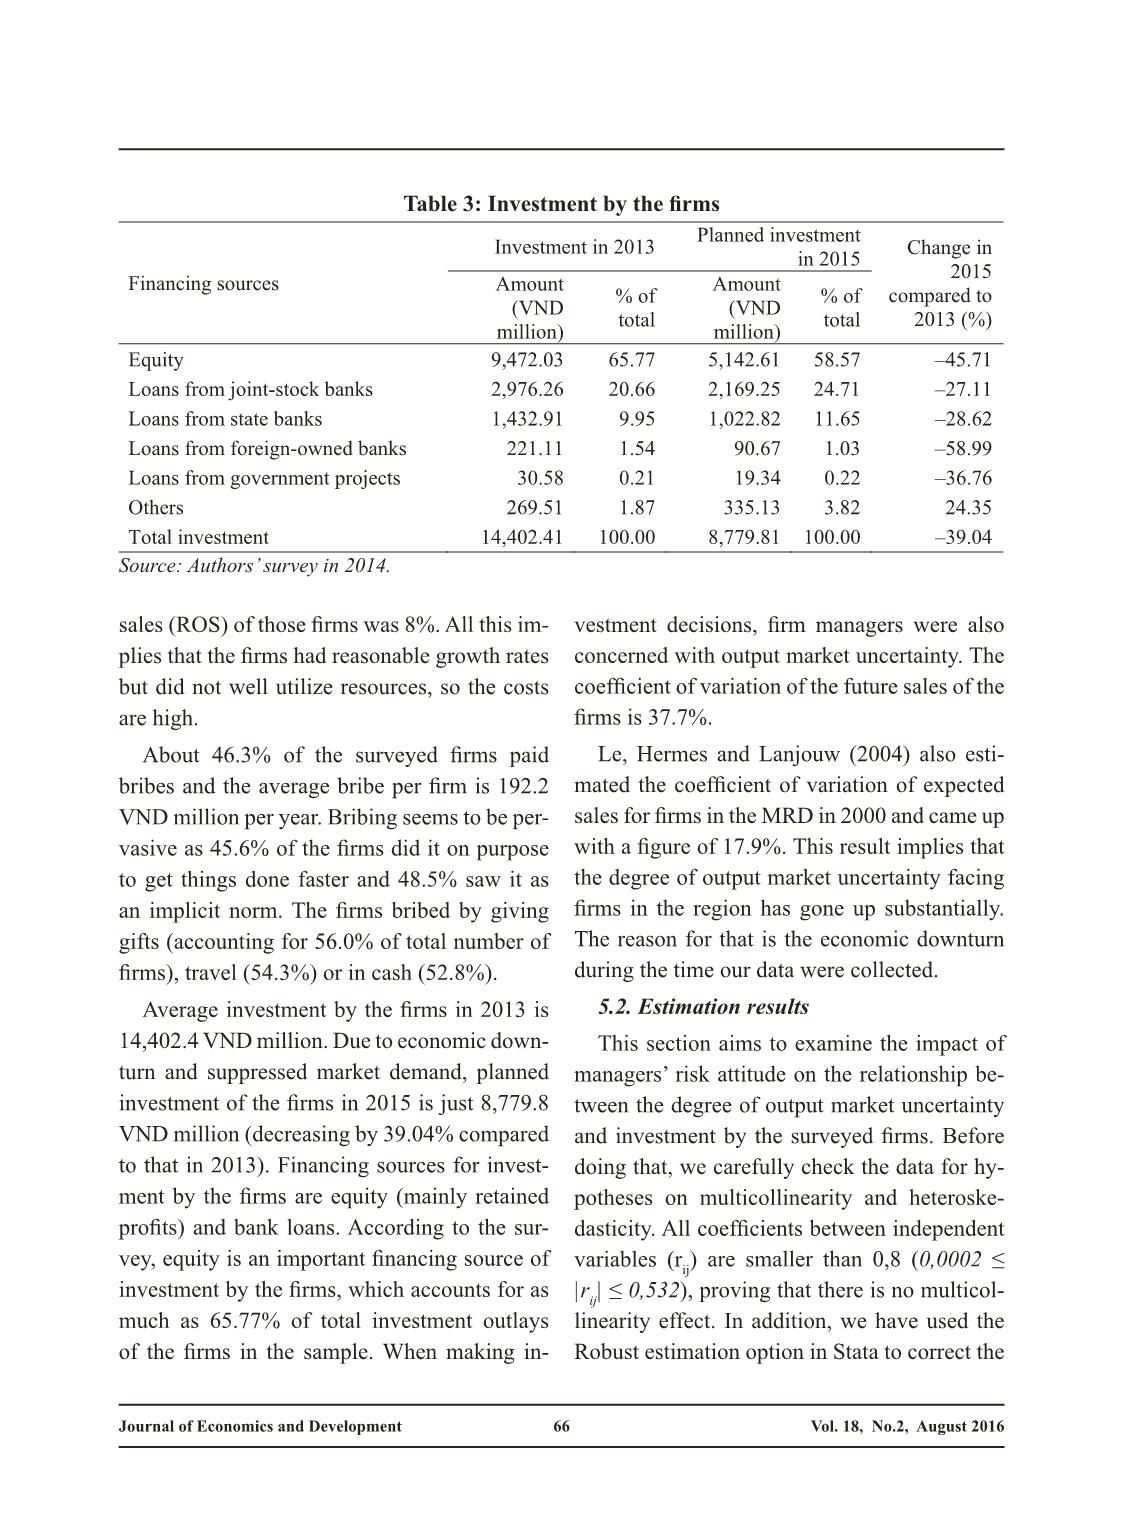
Average investment by the firms in 2013 is
14,402.4 VND million. Due to economic down-
turn and suppressed market demand, planned
investment of the firms in 2015 is just 8,779.8
VND million (decreasing by 39.04% compared
to that in 2013). Financing sources for invest-
ment by the firms are equity (mainly retained
profits) and bank loans. According to the sur-
vey, equity is an important financing source of
investment by the firms, which accounts for as
much as 65.77% of total investment outlays
of the firms in the sample. When making in-
vestment decisions, firm managers were also
concerned with output market uncertainty. The
coefficient of variation of the future sales of the
firms is 37.7%.
Le, Hermes and Lanjouw (2004) also esti-
mated the coefficient of variation of expected
sales for firms in the MRD in 2000 and came up
with a figure of 17.9%. This result implies that
the degree of output market uncertainty facing
firms in the region has gone up substantially.
The reason for that is the economic downturn
during the time our data were collected.
5.2. Estimation results
This section aims to examine the impact of
managers’ risk attitude on the relationship be-
tween the degree of output market uncertainty
and investment by the surveyed firms. Before
doing that, we carefully check the data for hy-
potheses on multicollinearity and heteroske-
dasticity. All coefficients between independent
variables (rij) are smaller than 0,8 (0,0002 ≤
|rij| ≤ 0,532), proving that there is no multicol-
linearity effect. In addition, we have used the
Robust estimation option in Stata to correct the
Table 3: Investment by the firms
Source: Authors’ survey in 2014.
Financing sources
Investment in 2013 Planned investment in 2015 Change in 2015
compared to
2013 (%)
Amount
(VND
million)
% of
total
Amount
(VND
million)
% of
total
Equity 9,472.03 65.77 5,142.61 58.57 –45.71
Loans from joint-stock banks 2,976.26 20.66 2,169.25 24.71 –27.11
Loans from state banks 1,432.91 9.95 1,022.82 11.65 –28.62
Loans from foreign-owned banks 221.11 1.54 90.67 1.03 –58.99
Loans from government projects 30.58 0.21 19.34 0.22 –36.76
Others 269.51 1.87 335.13 3.82 24.35
Total investment 14,402.41 100.00 8,779.81 100.00 –39.04
Journal of Economics and Development Vol. 18, No.2, August 201667
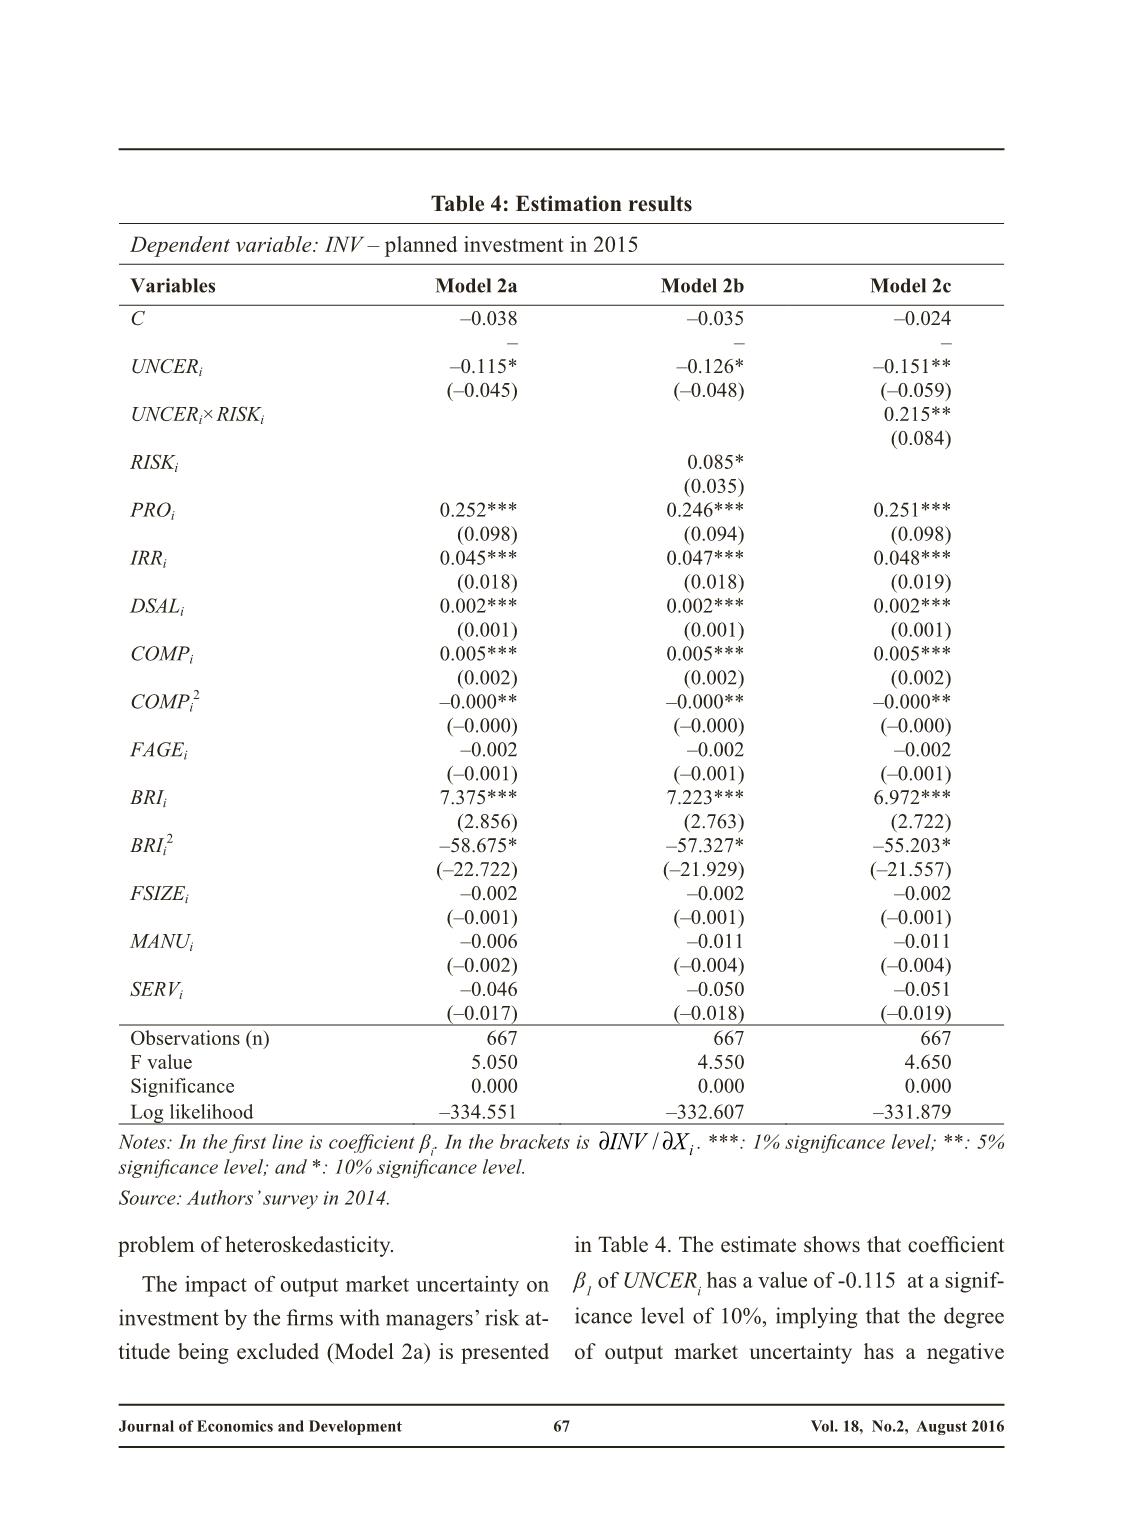
Table 4: Estimation results
Notes: In the first line is coefficient βi. In the brackets is iXINV ∂∂ / . ***: 1% significance level; **: 5%
significance level; and *: 10% significance level.
Source: Authors’ survey in 2014.
Dependent variable: INV – planned investment in 2015
Variables Model 2a Model 2b Model 2c
C –0.038
–
–0.035
–
–0.024
–
UNCERi –0.115*
(–0.045)
–0.126*
(–0.048)
–0.151**
(–0.059)
UNCERi×RISKi 0.215**
(0.084)
RISKi 0.085*
(0.035)
PROi 0.252***
(0.098)
0.246***
(0.094)
0.251***
(0.098)
IRRi 0.045***
(0.018)
0.047***
(0.018)
0.048***
(0.019)
DSALi 0.002***
(0.001)
0.002***
(0.001)
0.002***
(0.001)
COMPi 0.005***
(0.002)
0.005***
(0.002)
0.005***
(0.002)
COMPi2 –0.000**
(–0.000)
–0.000**
(–0.000)
–0.000**
(–0.000)
FAGEi –0.002
(–0.001)
–0.002
(–0.001)
–0.002
(–0.001)
BRIi 7.375***
(2.856)
7.223***
(2.763)
6.972***
(2.722)
BRIi
2 –58.675*
(–22.722)
–57.327*
(–21.929)
–55.203*
(–21.557)
FSIZEi –0.002
(–0.001)
–0.002
(–0.001)
–0.002
(–0.001)
MANUi –0.006
(–0.002)
–0.011
(–0.004)
–0.011
(–0.004)
SERVi –0.046
(–0.017)
–0.050
(–0.018)
–0.051
(–0.019)
Observations (n) 667 667 667
F value 5.050 4.550 4.650
Significance 0.000 0.000 0.000
Log likelihood –334.551 –332.607 –331.879
problem of heteroskedasticity.
The impact of output market uncertainty on
investment by the firms with managers’ risk at-
titude being excluded (Model 2a) is presented
in Table 4. The estimate shows that coefficient
β1 of UNCERi has a value of -0.115 at a signif-
icance level of 10%, implying that the degree
of output market uncertainty has a negative
Journal of Economics and Development Vol. 18, No.2, August 201668
impact on investment by the surveyed firms.
RISKi is added to Model 2b (Table 4) to esti-
mate the impact of managers’ risk attitude on
investment, regardless of output market uncer-
tainty. The coefficient of RISKi is 0.085 at a sig-
nificance level of 10%. This would mean that
risk-loving managers tend to investment more
than risk-averse ones do, others being equal.
However, recent studies argue that there is an
interaction between the degree of output market
uncertainty and managers’ risk attitude to influ-
ence firm investment. Therefore, Model 2c (Ta-
ble 4) aims to find evidence for this argument.
Indeed, coefficient β2 of the interactive term
UNCERi×RISKi has a value of 0.215 at a signif-
icance level of 5%. Obviously, risk-loving man-
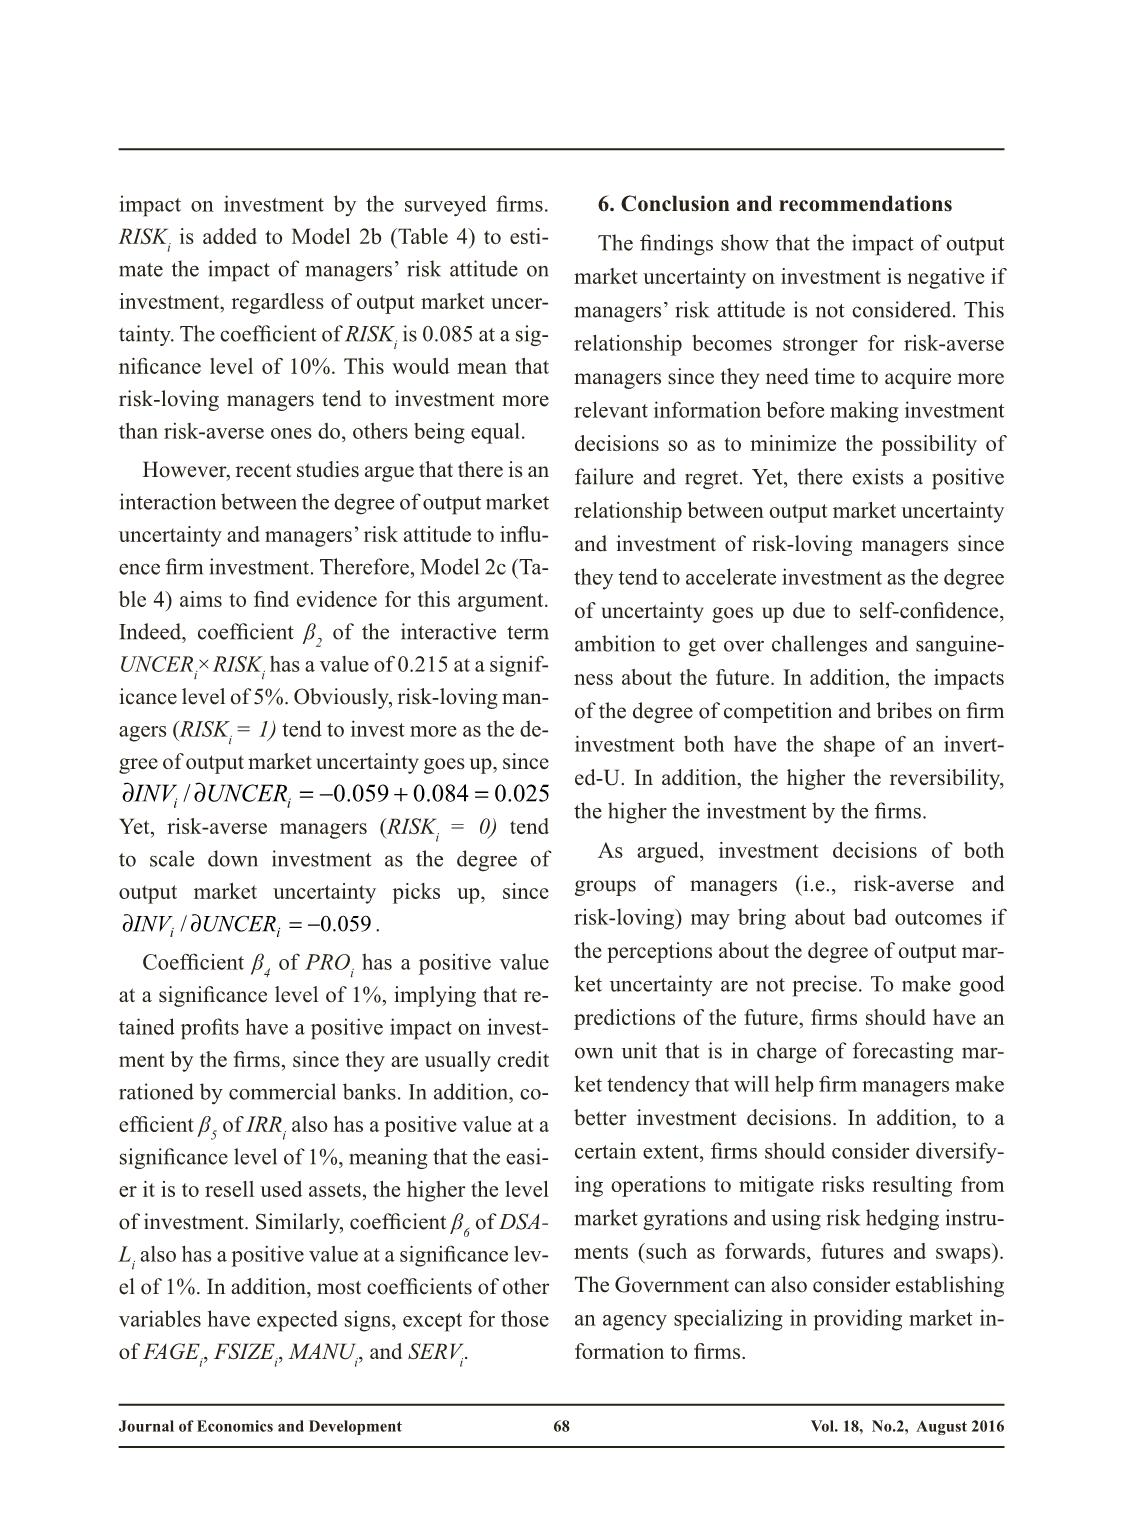
agers (RISKi = 1) tend to invest more as the de-
gree of output market uncertainty goes up, since
025.0084.0059.0/ =+−=∂∂ ii UNCERINV
Yet, risk-averse managers (RISKi = 0) tend
to scale down investment as the degree of
output market uncertainty picks up, since
059.0/ −=∂∂ ii UNCERINV .
Coefficient β4 of PROi has a positive value
at a significance level of 1%, implying that re-
tained profits have a positive impact on invest-
ment by the firms, since they are usually credit
rationed by commercial banks. In addition, co-
efficient β5 of IRRi also has a positive value at a
significance level of 1%, meaning that the easi-
er it is to resell used assets, the higher the level
of investment. Similarly, coefficient β6 of DSA-
Li also has a positive value at a significance lev-
el of 1%. In addition, most coefficients of other
variables have expected signs, except for those
of FAGEi, FSIZEi, MANUi, and SERVi.
6. Conclusion and recommendations
The findings show that the impact of output
market uncertainty on investment is negative if
managers’ risk attitude is not considered. This
relationship becomes stronger for risk-averse
managers since they need time to acquire more
relevant information before making investment
decisions so as to minimize the possibility of
failure and regret. Yet, there exists a positive
relationship between output market uncertainty
and investment of risk-loving managers since
they tend to accelerate investment as the degree
of uncertainty goes up due to self-confidence,
ambition to get over challenges and sanguine-
ness about the future. In addition, the impacts
of the degree of competition and bribes on firm
investment both have the shape of an invert-
ed-U. In addition, the higher the reversibility,
the higher the investment by the firms.
As argued, investment decisions of both
groups of managers (i.e., risk-averse and
risk-loving) may bring about bad outcomes if
the perceptions about the degree of output mar-
ket uncertainty are not precise. To make good
predictions of the future, firms should have an
own unit that is in charge of forecasting mar-
ket tendency that will help firm managers make
better investment decisions. In addition, to a
certain extent, firms should consider diversify-
ing operations to mitigate risks resulting from
market gyrations and using risk hedging instru-
ments (such as forwards, futures and swaps).
The Government can also consider establishing
an agency specializing in providing market in-
formation to firms.
Journal of Economics and Development Vol. 18, No.2, August 201669
Notes:
1. From the data gathered, we are able to calculate the conditional mean and variance
 of the growth rate of sales in 2015 as perceived in 2014 ( 0S is the sales in the base
year (2013), ed is the expected mean of the growth of sales in 2015 and e)( 2σ is the expected variance
of the growth rate of sales in 2015). Based on those variables, we calculate the coefficient of variation
of expected sales .
References
Aghion, P., Bloom, N., Blundell, R., Griffith, R. and Howitt, P. (2005), ‘Competition and Innovation: An
Inverted–U Relationship’, Quarterly Journal of Economics, 120(2), 701–728.
Aistov, A. and Kuzmicheva, E. (2012), ‘Investment Decisions under Uncertainty: Example of Russian
Companies’, Proceedings in Finance and Risk Perspectives, 12, 378–392.
Akdoğu, E. and MacKay, P. (2008), ‘Investment and Competition’, Journal of Financial and Quantitative
Analysis, 43(2), 299–330.
Andrade, G. and Stafford, E. (2004), ‘Investigating the Economic Role of Mergers’, Journal of Corporate
Finance, 10, 1–36.
Antonides, G. and Van der Sar, N. L. (1990), ‘Individual Expectations, Risk Perception and Preferences in
Relation to Investment Decision Making’, Journal of Economic Psychology, 11, 227-245.
Bayraktar, N. (2014), ‘Fixed Investment/Fundamental Sensitivities under Financial Constraints’, Journal of
Economics and Business, 75, 25–59.
Berk, J. (1999), ‘A Simple Approach for Deciding When to Invest’, American Economic Review 89(5),
1319–1326.
Block, J., Sandner, P. and Spiegel (2015), ‘How Do Risk Attitudes Differ within the Group of Entrepreneurs?
The Role of Motivation and Procedural Utility’, Journal of Small Business Management, 53(1), 183–
206.
Bo, H. and Lensink, R. (2005), ‘Is the Investment–Uncertainty Relationship Non-Linear? An Empirical
Analysis for the Netherlands,’ Economica, 72(286), 307–331.
Bo, H. and Sterken, S. (2007), ‘Attitude towards Risk, Uncertainty, and Fixed Investment,’ The North
American Journal of Economics and Finance, 18(1), 59–75.
Boone, J. (2000), ‘Competitive Pressure: the Effects on Investments in Product and Process Innovation’,
Rand Journal of Economics, 31(3), 549–569.
Boone, J. (2001), ‘Intensity of Competition and the Incentive to Innovate’, International Journal of
Industrial Organization, 19, 705–726.
Boone, J. (2008), ‘A New Way to Measure Competition’, Economic Journal, 118, 1245–1261.
Chronopoulos, M., De Reyck, B. and Siddiqui, A. (2011), ‘Optimal Investment under Operational Flexibility,
Risk Aversion, and Uncertainty’, European Journal of Operational Research, 213, 221–237.
Driver, C. and Whelan, B. (2001), ‘The Effect of Business Risk on Manufacturing Investment Sectorial
Survey Evidence from Ireland’, Journal of Economic Behavior & Organization, 44, 403–412.
Femminis, G. (2008), ‘Risk-Aversion and the Investment–Uncertainty Relationship: The Role of Capital
Depreciation’, Journal of Economic Behavior & Organization, 65, 585–591.
Ghosal, V. and Loungani, P. (2000), ‘The Differential Impact of Uncertainty on Investment in Small and
Large Businesses’, Review of Economics and Statistics, 82(2), 338-343.
Journal of Economics and Development Vol. 18, No.2, August 201670
Guiso, L. and Parigi, G. (1999), ‘Investment and Demand Uncertainty’, Quarterly Journal of Economics,
114, 185–227.
Hansen, J. A. (1992), ‘Innovation, Firm Size, and Firm Age’, Small Business Economics, 4(1), 37-44.
Le Khuong Ninh (2008), ‘Bribing and Investment Decisions by Non-state Firms in the Mekong River
Delta’, Economic Review, 3-2008 (in Vietnamese), 68–76.
Le Khuong Ninh, Hermes, N. and Lanjouw, G. (2004), ‘Investment, Uncertainty and Irreversibility: An
Empirical Study of Rice Mills in the Mekong River Delta, Vietnam’, Economics of Transition 12(2),
307–332.
Le Khuong Ninh, Phan Anh Tu, Pham Le Thong, Le Tan Nghiem and Huynh Viet Khai (2007), ‘An Analysis
of Factors Affecting Investment Decisions by Non-state Firms in the Mekong River Delta’, Economic
Review, 4-2007 (in Vietnamese), 47–55.
Luehrman, T., (1998), ‘Investment Opportunities as Real Options: Getting Started on the Numbers’,
Harvard Business Review, July-August, 3–15.
Maki, T., Yotsuya, K. and Yagi, T. (2005), ‘Economic Growth and the Riskiness of Investment in Firm-
Specific Skills’, European Economic Review, 49, 1033–1049.
Moohammad, A. Y., Nor’Aini, Y., and Kamal, E. M. (2014), ‘Influences of Firm Size, Age and Sector
on Innovation Behavior of Construction Consultancy Services Organizations in Developing
Countries’, Culture, 4(4), 01-09.
Moretto, M. (2008), ‘Competition and Irreversible Investments under Uncertainty’, Information Economics
and Policy, 20, 75–88.
Nakamura, T. (1999), ‘Risk-Aversion and the Uncertainty-Investment Relationship: A Note’, Journal of
Economic Behavior & Organization, 38, 357–363.
Nielsen, M.J. (2002), ‘Competition and Irreversible Investments’, International Journal of Industrial
Organization, 20(2002), 731–743.
Nishihara, M. and Shibata, T. (2014), ‘Preemption, Leverage, and Financing Constraints’, Review of
Financial Economics, 23, 75–89.
Polder, M and Veldhuizen, E. (2012), ‘Innovation and Competition in the Netherlands: Testing the
Inverted–U for Industries and Firms’, Journal of Industry, Competition and Trade, 12(1), 67–91.
Svensson, J. (2005), ‘Eight Questions about Corruption’, Journal of Economic Perspectives, 19(3), 19–42.
Whalley, A. E. (2011), ‘Optimal R&D Investment for a Risk-Averse Entrepreneur’, Journal of Economic
Dynamics & Control, 35, 413–429.
File đính kèm:
 risk_attitude_and_corporate_investment_under_output_market_u.pdf

