Investigation on unsteady behavior of near - wake flow of a blunt - base body by an optical - flow algorithm
Abstract
In this study, an optical-flow algorithm was applied to analyzing unsteady behavior of nearwake flow. The experiment was conducted at low-speed conditions and at Reynolds
number around ReD = 1.97×10⁴ to obtain image database for optical-flow processing.
Measurement frequency was at 2000 fps. Results of the optical-flow algorithm were
compared to previous studies by a traditional cross-correlation method. The ability of
optical flow method to extract flow fields was, thereby, confirmed for blunt-base flow at
low-speed conditions. Differing from previous studies and cross-correlation results, opticalflow results showed a dominated Strouhal number at around StD = 0.015, which is
connected to vortex shedding behavior of the wake-flow. Additionally, the antisymmetric
flow shows the most important behavior at low-speed conditions.
Keywords: Optical flow; axisymmetric body; near-wake; recirculation region; PIV.
Trang 1
Trang 2
Trang 3
Trang 4
Trang 5
Trang 6
Trang 7
Trang 8
Trang 9
Trang 10
Tải về để xem bản đầy đủ
Tóm tắt nội dung tài liệu: Investigation on unsteady behavior of near - wake flow of a blunt - base body by an optical - flow algorithm
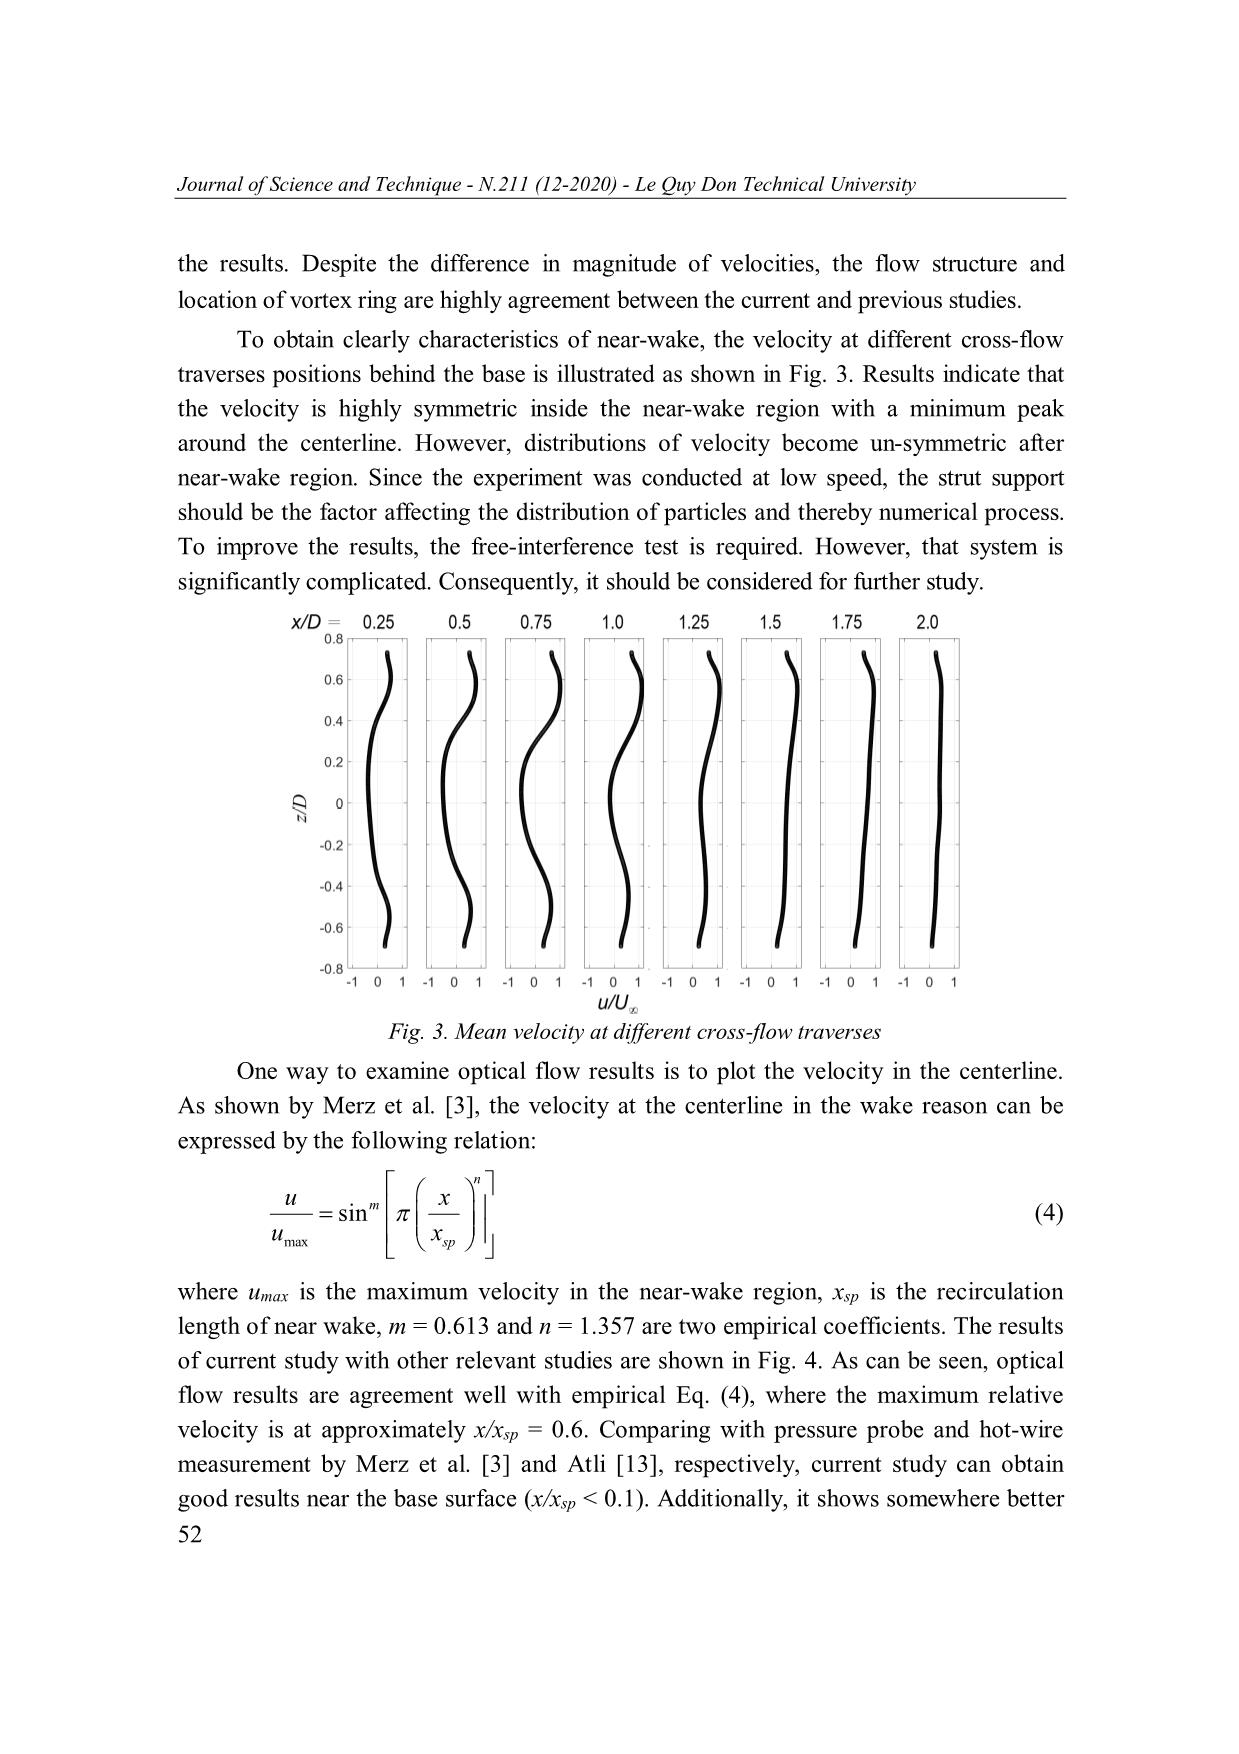
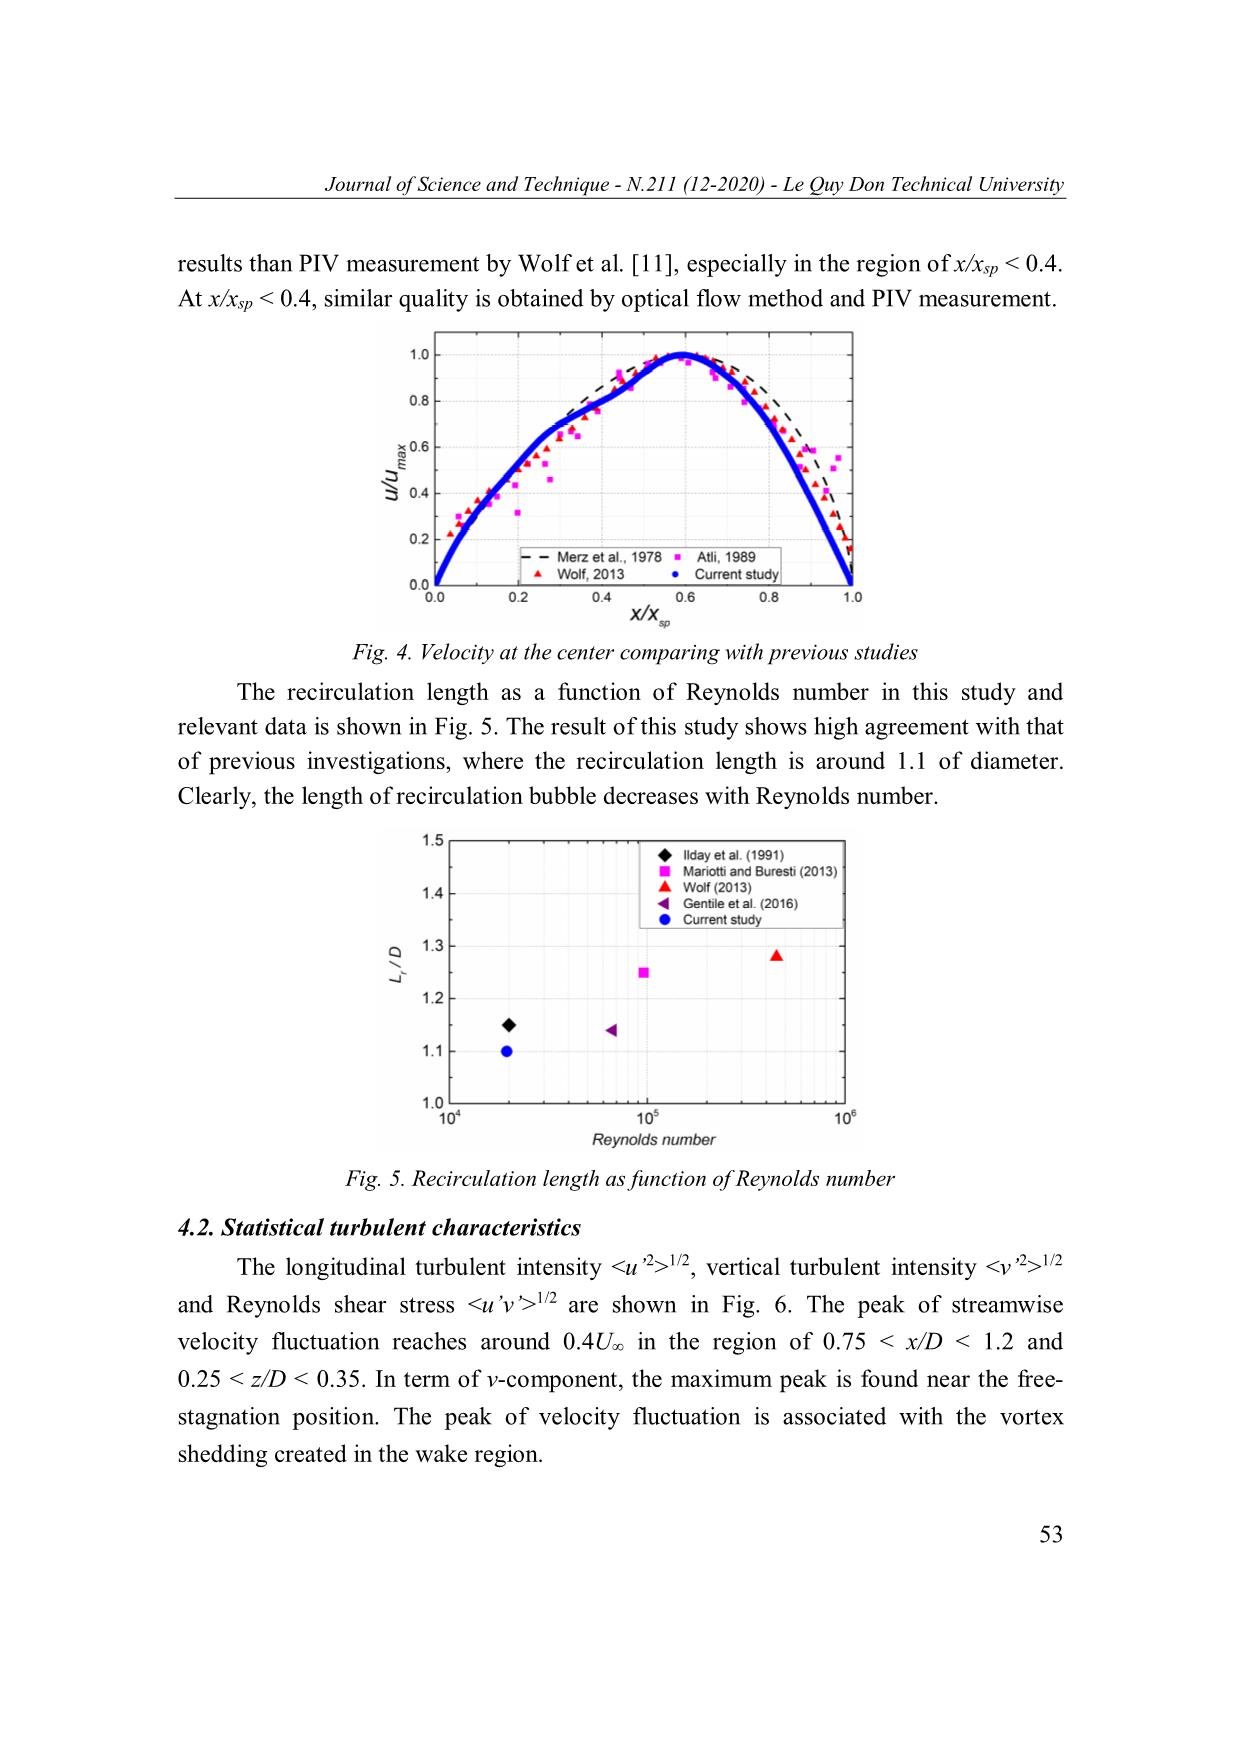
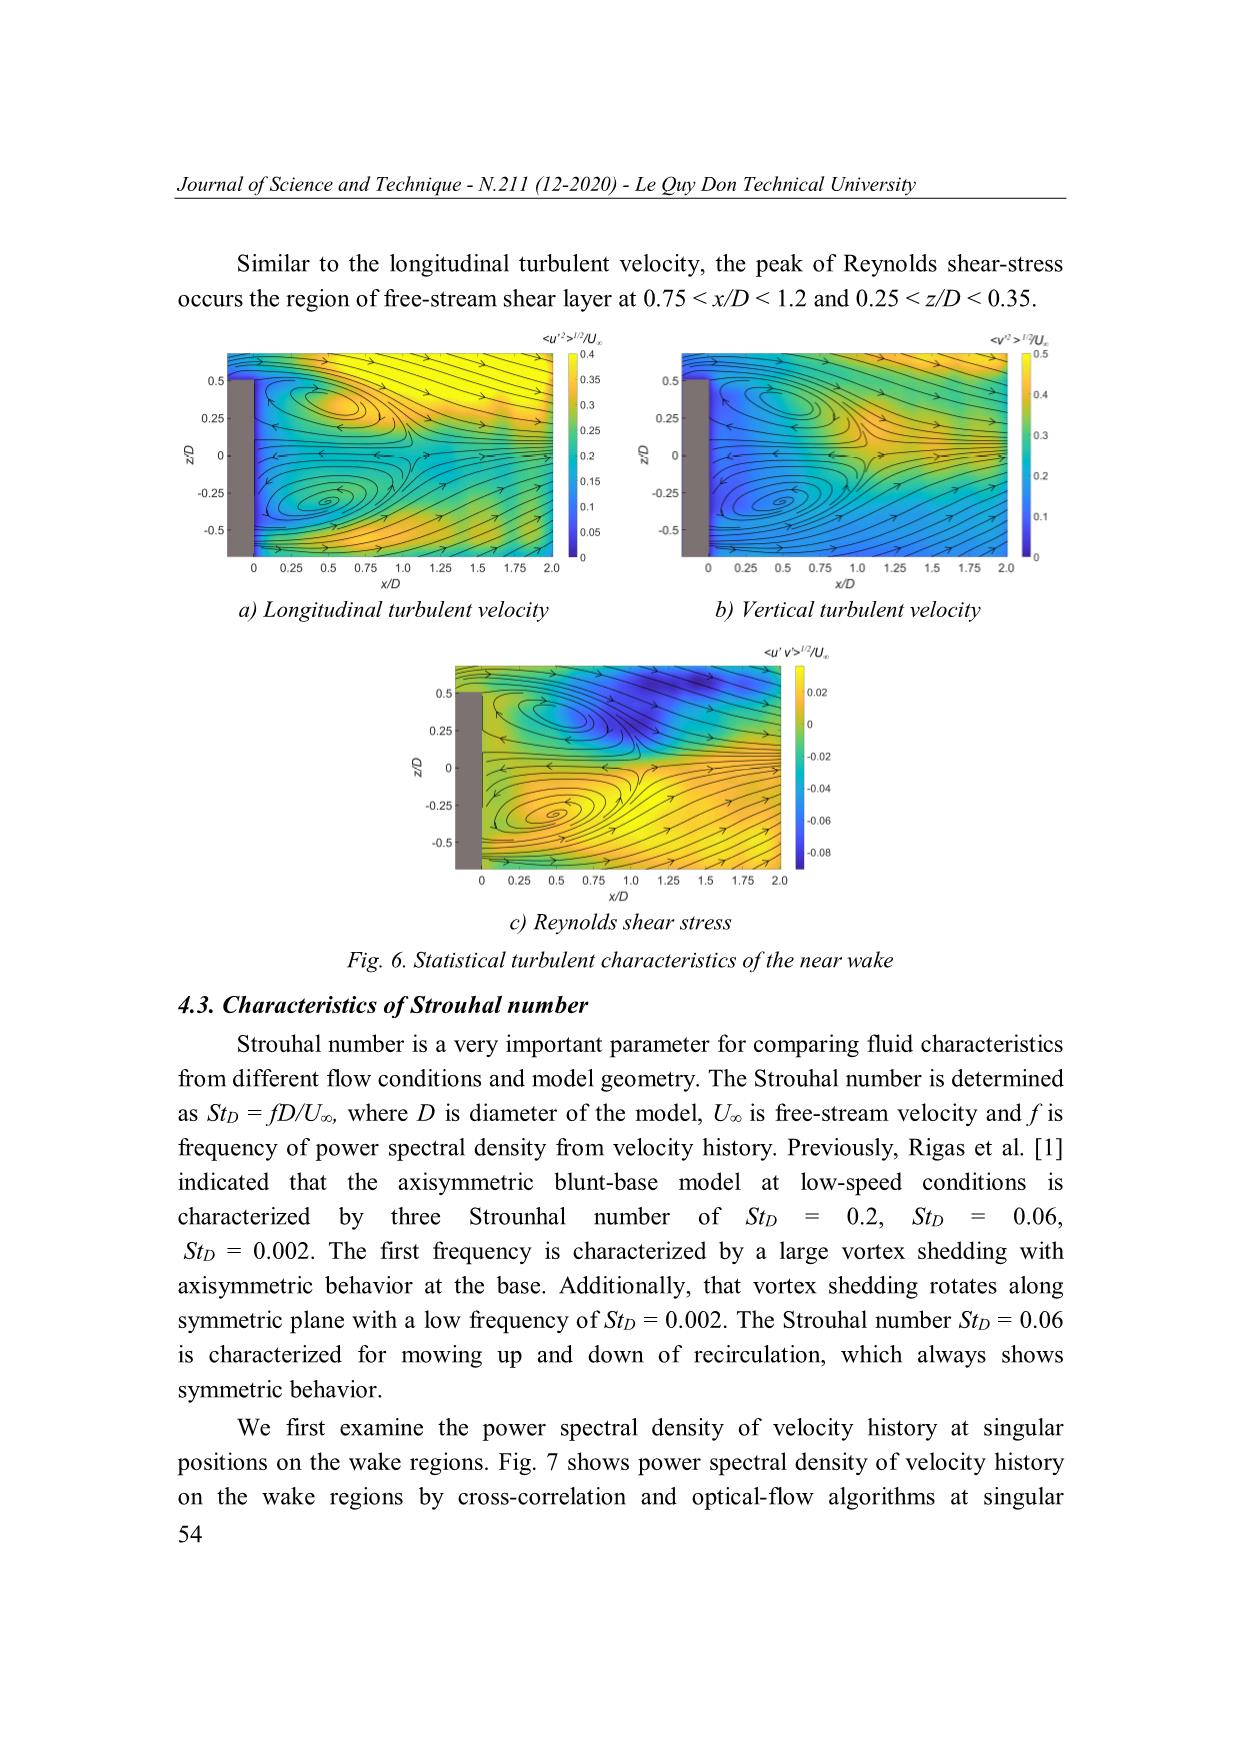
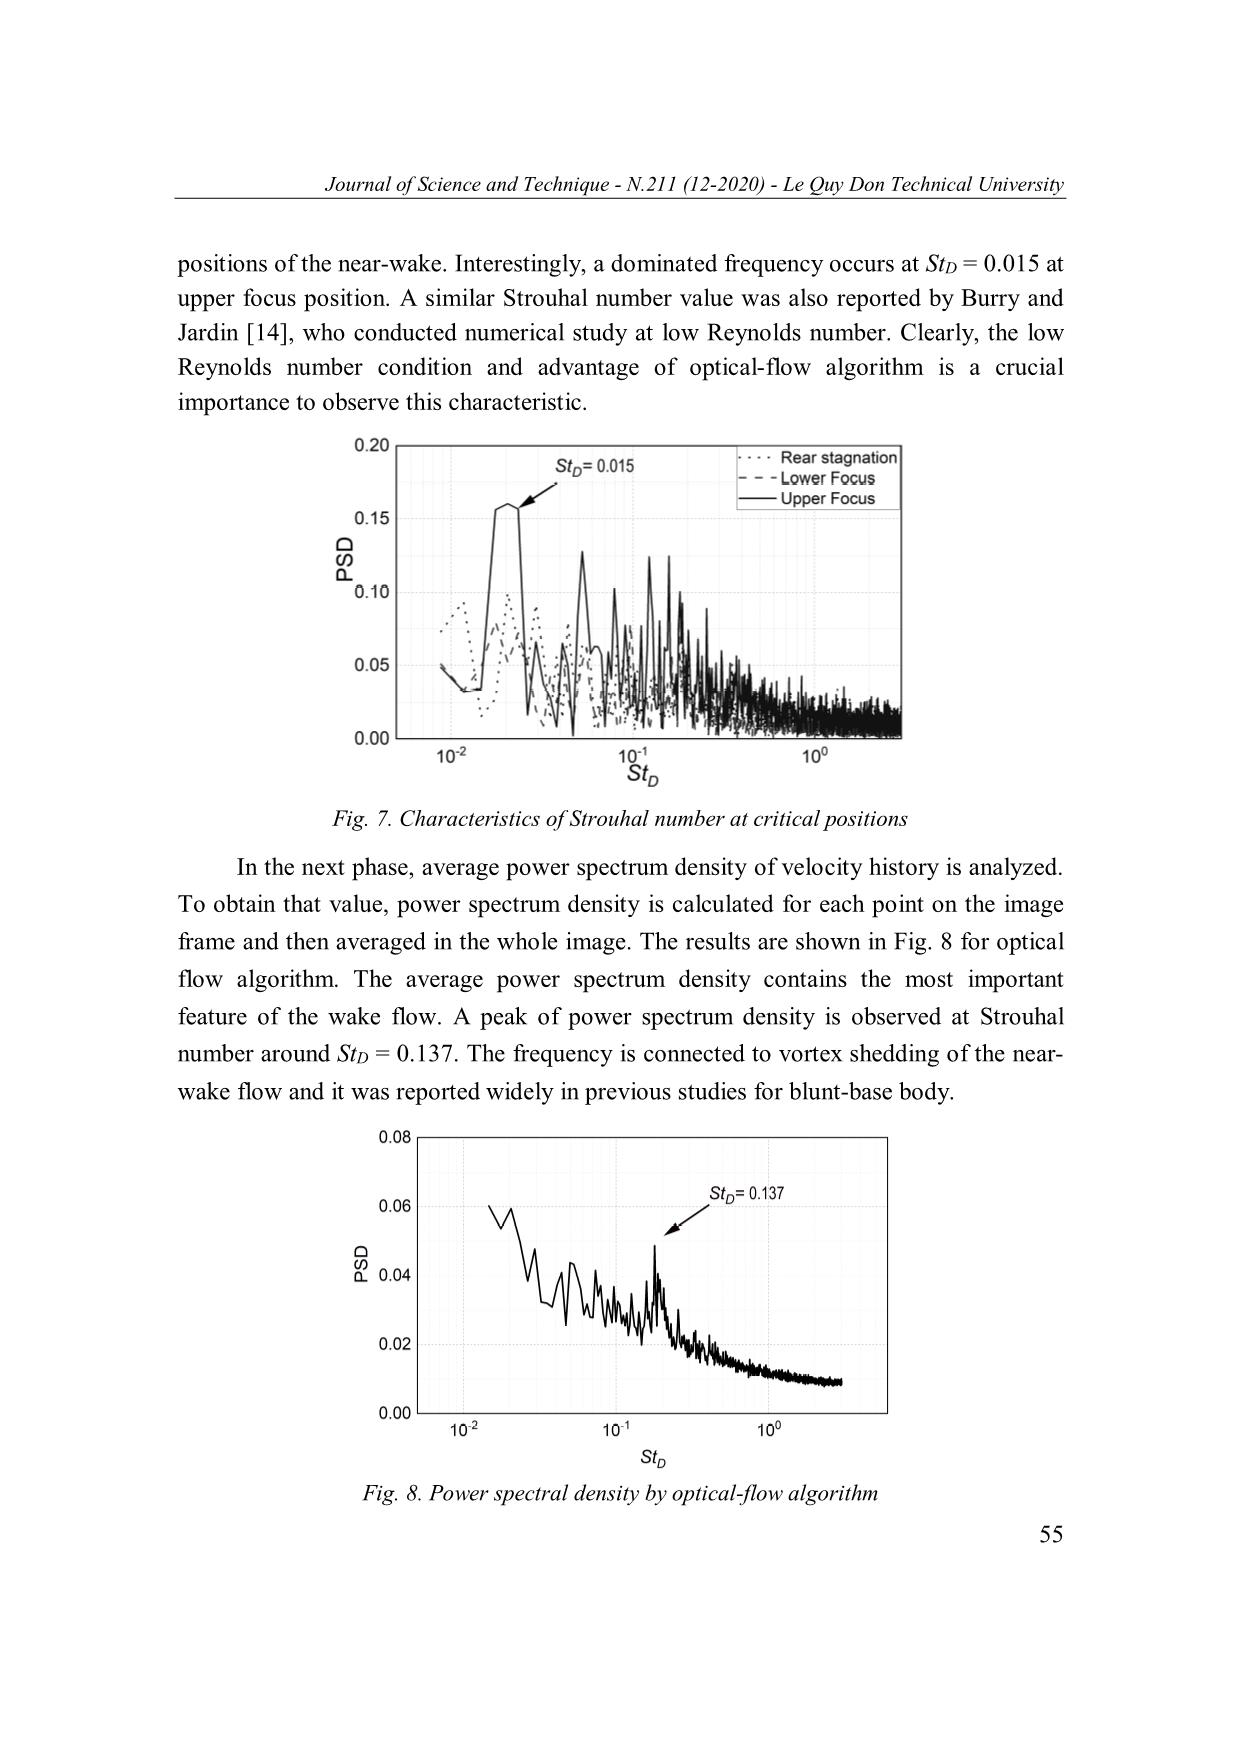
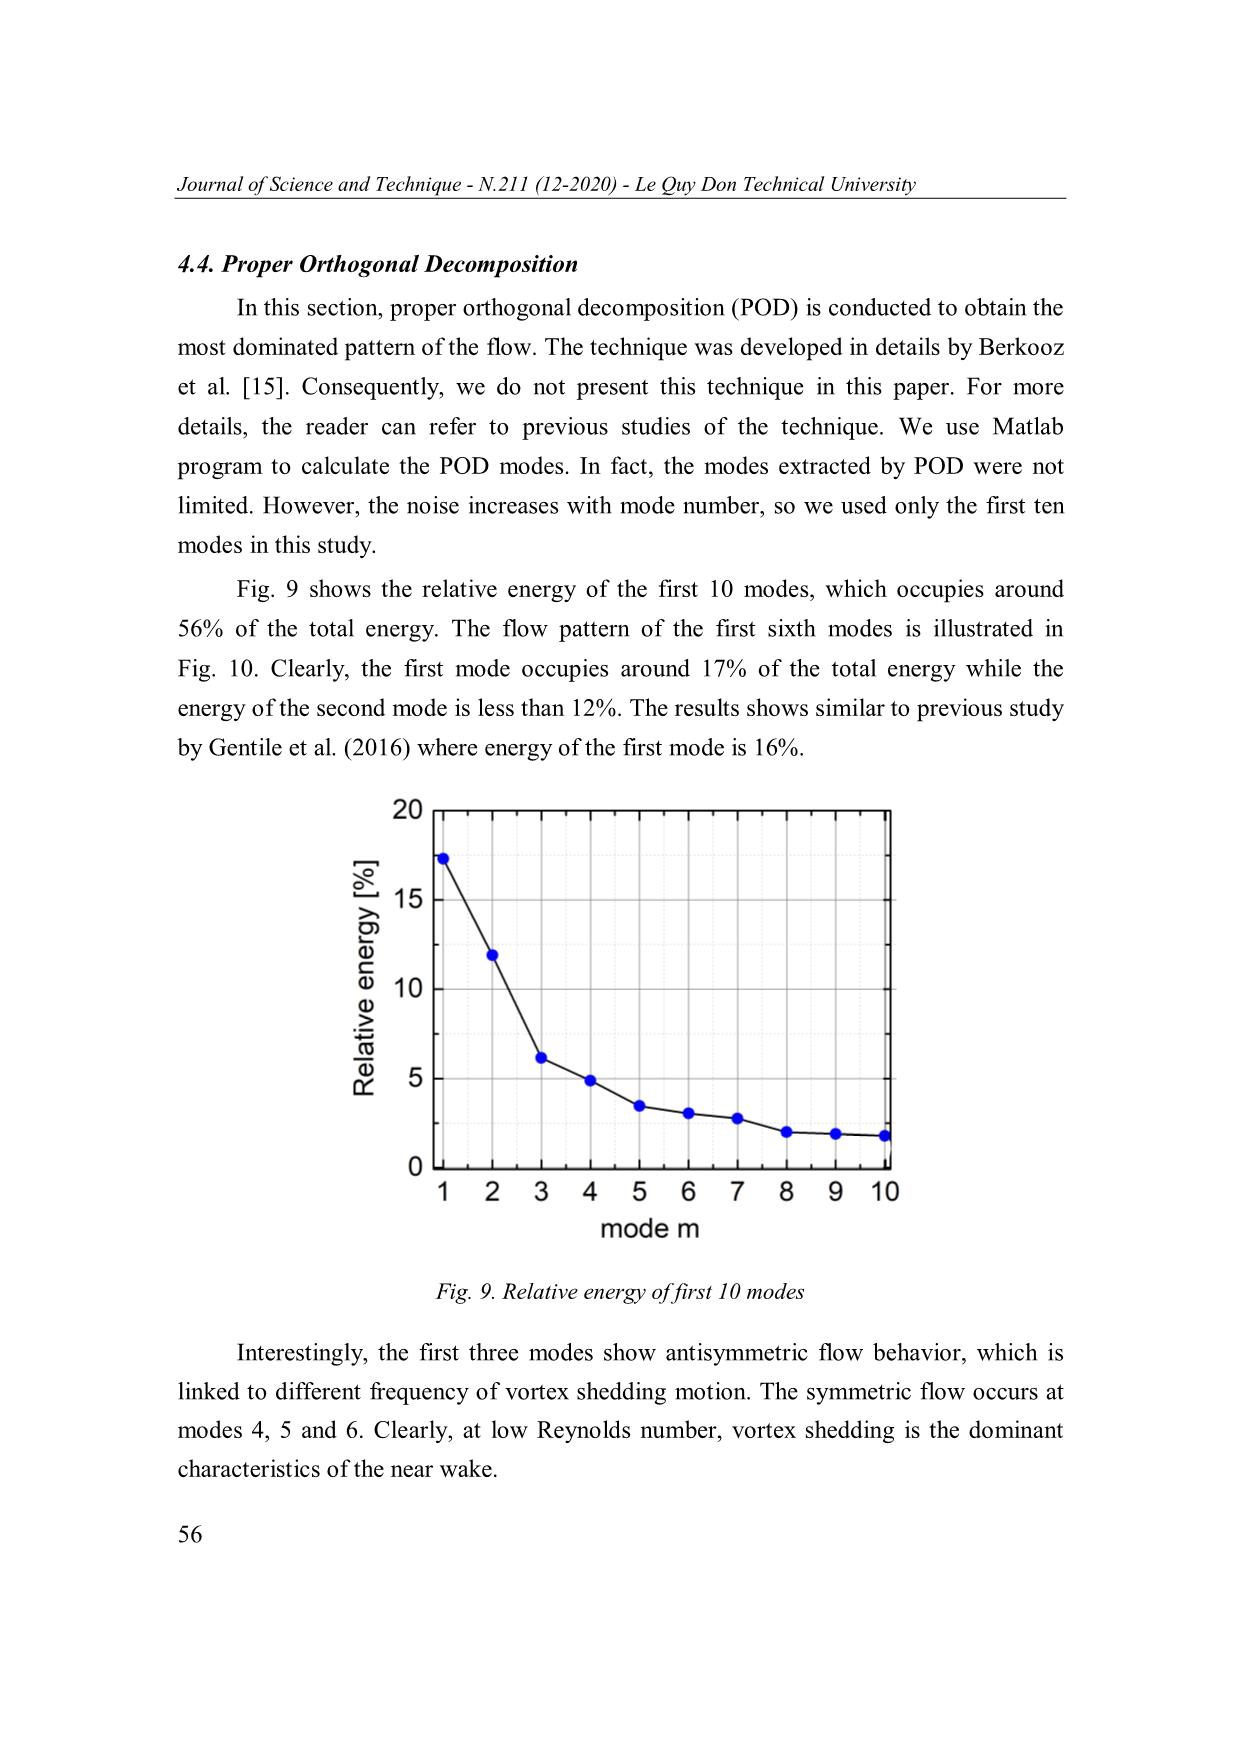
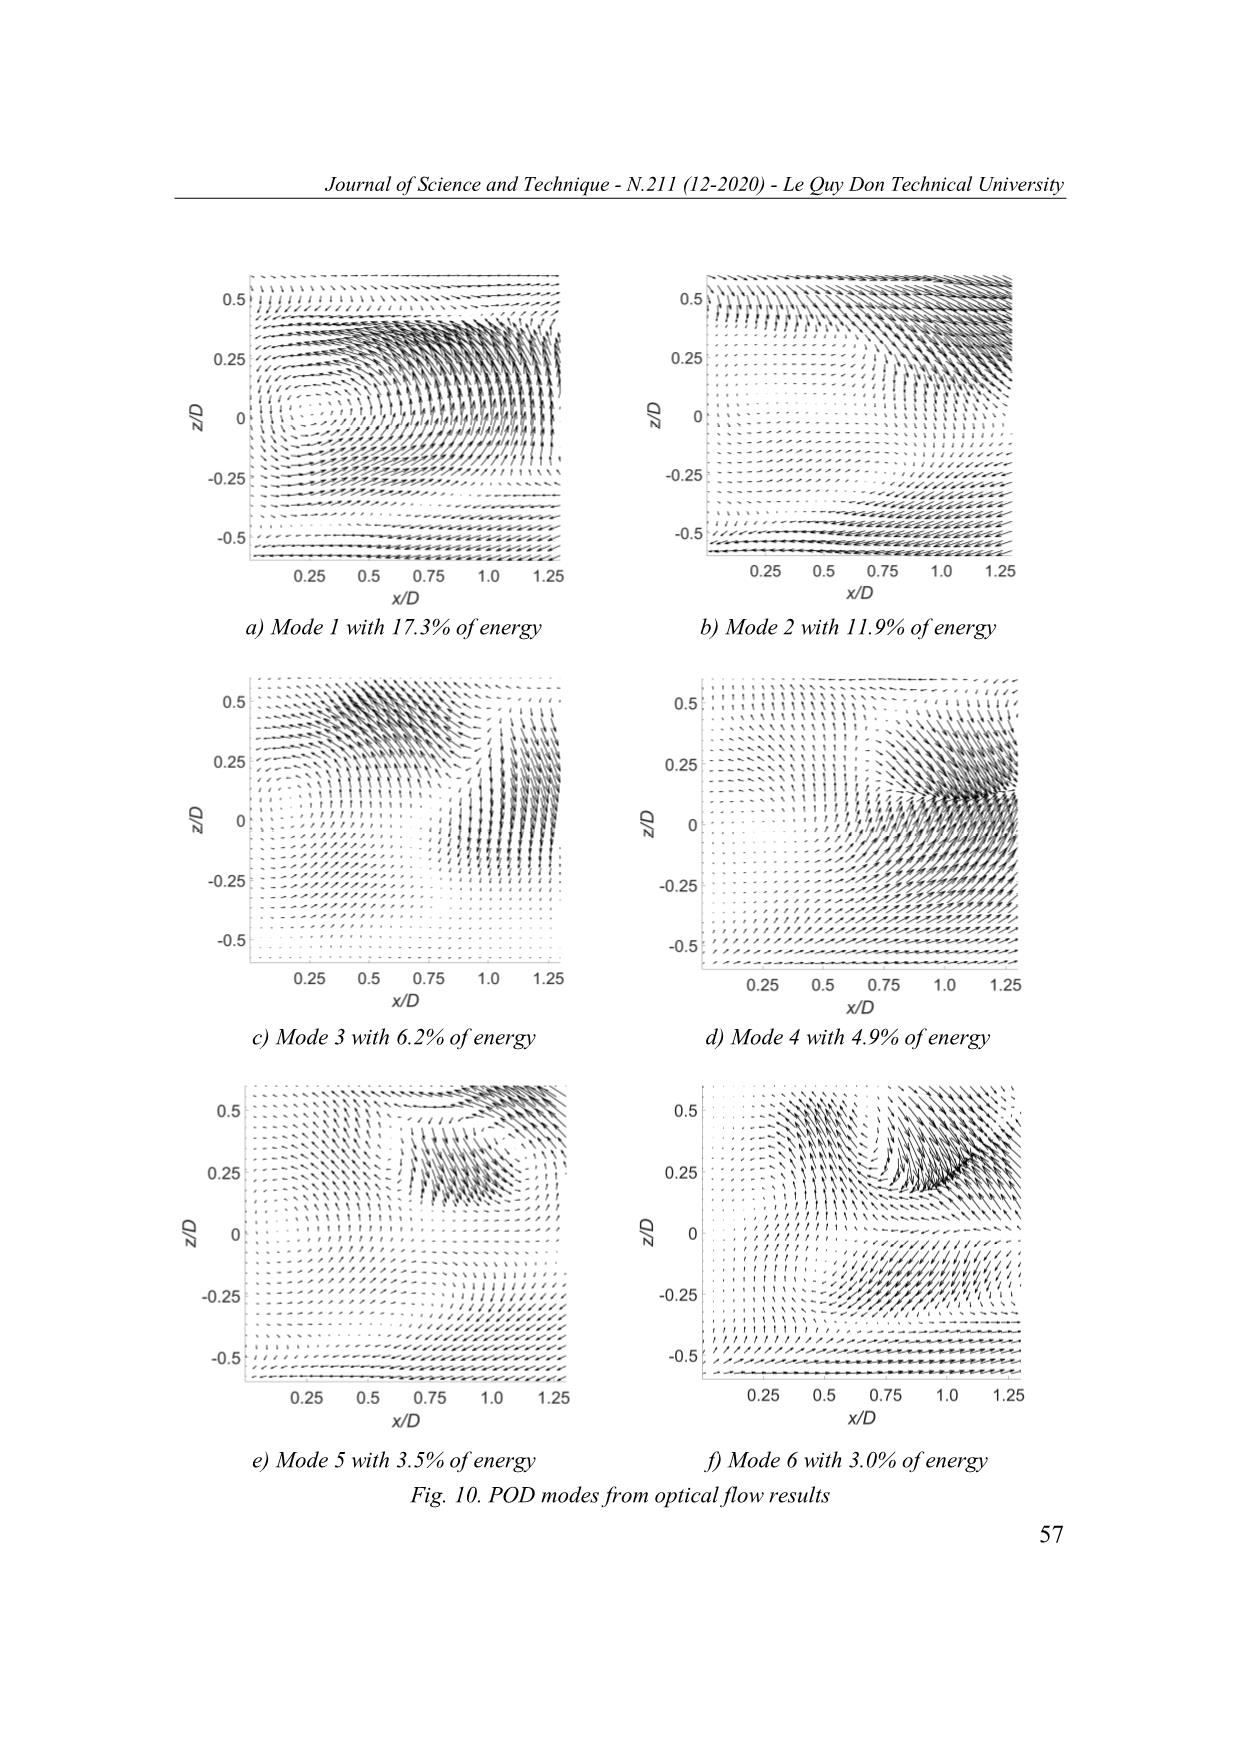
Journal of Science and Technique - N.211 (12-2020) - Le Quy Don Technical University INVESTIGATION ON UNSTEADY BEHAVIOR OF NEAR-WAKE FLOW OF A BLUNT-BASE BODY BY AN OPTICAL-FLOW ALGORITHM Tran The Hung*, Chu Hoang Quan, Trinh Xuan Long Le Quy Don Technical University, Hanoi, Vietnam Abstract In this study, an optical-flow algorithm was applied to analyzing unsteady behavior of near- wake flow. The experiment was conducted at low-speed conditions and at Reynolds 4 number around ReD = 1.97×10 to obtain image database for optical-flow processing. Measurement frequency was at 2000 fps. Results of the optical-flow algorithm were compared to previous studies by a traditional cross-correlation method. The ability of optical flow method to extract flow fields was, thereby, confirmed for blunt-base flow at low-speed conditions. Differing from previous studies and cross-correlation results, optical- flow results showed a dominated Strouhal number at around StD = 0.015, which is connected to vortex shedding behavior of the wake-flow. Additionally, the antisymmetric flow shows the most important behavior at low-speed conditions. Keywords: Optical flow; axisymmetric body; near-wake; recirculation region; PIV. 1. Introduction The axisymmetric body is widely applied in moving vehicles such as aircraft missiles and projectiles. However, a sudden change of geometry causes a large separation at the base. The separation flow forms near-wake region which shows high turbulent characteristics. It is the main source of drag, structure fatigue and low stability [1]. In fact, near-wake flow is an important topic in fluid dynamics and it was widely investigated at high-speed conditions. Tanner [2] showed that a large shock-wave could occur near the base edge, which results in increasing aerodynamic drag of the model. Merz et al. [3], who studied near-wake flow at subsonic conditions, illustrated that the base pressure is nearly constant with Mach number. They also indicated that the base flow is dominated by a Strouhal number of StD = 0.2. Ilday et al. [4], who used hot-wire to measure wake flow, showed that the length of near wake is around 1.1 diameter of the model. Recently, Mariotti and Buresti [5], who used hot wire to measure near-wake structure at low speeds, found that the recirculation length expands with boundary layer thickness. Clearly, the wake structure is a function of Mach number, Reynolds number and boundary-layer conditions. However, previous studies mainly focused on local * Email: thehungmfti@gmail.com 48 Journal of Science and Technique - N.211 (12-2020) - Le Quy Don Technical University measurement method. Additionally, using intrusive device could disturb the base flow and reduce the accuracy of measurement. Recently, the development of technology and computational vision provides a high potential technique in analyzing flow field. Particle image velocimetry (PIV), which is non-intrusive technique, has been developed for flow measurement. In that technique, luminescent smoke is immersed in the flow. The movement of smoke particles around model is recorded for data processing. The algorithms for data processing could be cross-correlation [6] or optical-flow methods [7]. In cross- correlation method, interrogation window is required, which reduces resolution of flow fields [6]. In contrast, optical-flow method, which processes each pixel of image frame, allows to obtain full resolution [7]. Although optical-flow algorithm could provide a high accuracy of averaged velocity fields, the transient flow behavior was not considered in previous studies. In this study, the transient behavior of near-wake flow was studied at low-speed conditions by an optical-flow algorithm. The experimental data was conducted at a low- speed wind tunnel at Tohoku University, Japan. The base-diameter Reynolds number is 4 approximately ReD = 1.97×10 . To validate the accuracy of the algorithm, optical-flow results were compared to relevant data of previous studies. We show that the optical-flow algorithm could provide more detailed of flow behavior than the ones by cross-correlation algorithm. The near-wake flow at low-speed conditions is characterized by two dominated frequencies a vortex shedding at StD = 0.137 and a frequency of StD = 0.015. 2. Experimental set-up The model in this study has an axisymmetric shape with a diameter of 30 mm and total length of 251 mm. It is supported by a strut with cross-section of NACA 0018. (Fig. 1). To trip the boundary layer, a sand paper of P20 was wrapped to the nose. The detail of experimental setup was presented by Tran et al. [8]. Fig. 1. Experimental setup for collection of images data 49 Journal of Science and Technique - N.211 (12-2020) - Le Quy Don Technical University The speed of wind tunnel was fixed at 10 m/s, which provides a base ... found. In detail, a discrete program was built to solve those equations. The solutions are solved by interaction 2 2 methods. The program is finished when total error up 1 u p v p 1 v p is smaller than the given error tolerance ε. For the faster convergence, Horn-Schunck algorithm [10] 50 Journal of Science and Technique - N.211 (12-2020) - Le Quy Don Technical University was conducted firstly to obtain initial solutions. Then, Liu-Shen algorithm was applied for final solutions. Clearly, instantaneous velocity can be obtained from a pair image. 4. Results and discussions 4.1. Instantaneous and time average flow field The instantaneous streamwise components of near-wake velocity are shown in Fig. 2a. Clearly, the afterbody is characterized by separated region with low velocity. Behind the base, a reversed flow region is observed. Flow reattaches at around x/D = 1.1 to form a circulation region. Inside the wake, the flow shows high turbulent. The free-stream mean velocity field on the symmetric plane, which is averaged from 2000 snapshot solutions, is shown in Fig. 2b. The results of optical flow measurement show some un-symmetric magnitude with respect to the centerline, where velocity in the upper area is higher than the below positions. It can be explained that because of strut support, the brightness of particle images on the lower part is lower than the upper part, which affects the results of optical flow method. However, the clear flow structure is shown. The flow is almost symmetric with respect to the horizontal axis z = 0. The length of near-wake is around 1.1 times of diameter. The near-wake flow shows a vortex ring with the cores at (x/D, z/D) = (0.55, ±0.4) and two stagnation positions: one in the base surface and one inside the wake region. a) Instantaneous velocity field b) Time-averaged velocity fields Fig. 2. Instantaneous and time-averaged streamwise velocity fields of near-wake The location of minimum velocity shows a good agreement with previous experimental results by Ilday et al., [4] who used hot-wire to measure the velocity wake near-wake and by Wolf et al. [11] and Gentile et al. [12] in later studies using PIV techniques. However, the minimum velocity is smaller than previous studies, which was around -0.4U∞. It can be explained by the effect of Reynolds number conditions (low Reynolds number in current study comparing with high Reynolds number in previous studies). Additionally, the difference in numerical process should be other factor affecting 51 Journal of Science and Technique - N.211 (12-2020) - Le Quy Don Technical University the results. Despite the difference in magnitude of velocities, the flow structure and location of vortex ring are highly agreement between the current and previous studies. To obtain clearly characteristics of near-wake, the velocity at different cross-flow traverses positions behind the base is illustrated as shown in Fig. 3. Results indicate that the velocity is highly symmetric inside the near-wake region with a minimum peak around the centerline. However, distributions of velocity become un-symmetric after near-wake region. Since the experiment was conducted at low speed, the strut support should be the factor affecting the distribution of particles and thereby numerical process. To improve the results, the free-interference test is required. However, that system is significantly complicated. Consequently, it should be considered for further study. Fig. 3. Mean velocity at different cross-flow traverses One way to examine optical flow results is to plot the velocity in the centerline. As shown by Merz et al. [3], the velocity at the centerline in the wake reason can be expressed by the following relation: n u x sinm (4) u x max sp where umax is the maximum velocity in the near-wake region, xsp is the recirculation length of near wake, m = 0.613 and n = 1.357 are two empirical coefficients. The results of current study with other relevant studies are shown in Fig. 4. As can be seen, optical flow results are agreement well with empirical Eq. (4), where the maximum relative velocity is at approximately x/xsp = 0.6. Comparing with pressure probe and hot-wire measurement by Merz et al. [3] and Atli [13], respectively, current study can obtain good results near the base surface (x/xsp < 0.1). Additionally, it shows somewhere better 52 Journal of Science and Technique - N.211 (12-2020) - Le Quy Don Technical University results than PIV measurement by Wolf et al. [11], especially in the region of x/xsp < 0.4. At x/xsp < 0.4, similar quality is obtained by optical flow method and PIV measurement. Fig. 4. Velocity at the center comparing with previous studies The recirculation length as a function of Reynolds number in this study and relevant data is shown in Fig. 5. The result of this study shows high agreement with that of previous investigations, where the recirculation length is around 1.1 of diameter. Clearly, the length of recirculation bubble decreases with Reynolds number. Fig. 5. Recirculation length as function of Reynolds number 4.2. Statistical turbulent characteristics The longitudinal turbulent intensity 1/2, vertical turbulent intensity 1/2 and Reynolds shear stress 1/2 are shown in Fig. 6. The peak of streamwise velocity fluctuation reaches around 0.4U∞ in the region of 0.75 < x/D < 1.2 and 0.25 < z/D < 0.35. In term of v-component, the maximum peak is found near the free- stagnation position. The peak of velocity fluctuation is associated with the vortex shedding created in the wake region. 53 Journal of Science and Technique - N.211 (12-2020) - Le Quy Don Technical University Similar to the longitudinal turbulent velocity, the peak of Reynolds shear-stress occurs the region of free-stream shear layer at 0.75 < x/D < 1.2 and 0.25 < z/D < 0.35. a) Longitudinal turbulent velocity b) Vertical turbulent velocity c) Reynolds shear stress Fig. 6. Statistical turbulent characteristics of the near wake 4.3. Characteristics of Strouhal number Strouhal number is a very important parameter for comparing fluid characteristics from different flow conditions and model geometry. The Strouhal number is determined as StD = fD/U∞, where D is diameter of the model, U∞ is free-stream velocity and f is frequency of power spectral density from velocity history. Previously, Rigas et al. [1] indicated that the axisymmetric blunt-base model at low-speed conditions is characterized by three Strounhal number of StD = 0.2, StD = 0.06, StD = 0.002. The first frequency is characterized by a large vortex shedding with axisymmetric behavior at the base. Additionally, that vortex shedding rotates along symmetric plane with a low frequency of StD = 0.002. The Strouhal number StD = 0.06 is characterized for mowing up and down of recirculation, which always shows symmetric behavior. We first examine the power spectral density of velocity history at singular positions on the wake regions. Fig. 7 shows power spectral density of velocity history on the wake regions by cross-correlation and optical-flow algorithms at singular 54 Journal of Science and Technique - N.211 (12-2020) - Le Quy Don Technical University positions of the near-wake. Interestingly, a dominated frequency occurs at StD = 0.015 at upper focus position. A similar Strouhal number value was also reported by Burry and Jardin [14], who conducted numerical study at low Reynolds number. Clearly, the low Reynolds number condition and advantage of optical-flow algorithm is a crucial importance to observe this characteristic. Fig. 7. Characteristics of Strouhal number at critical positions In the next phase, average power spectrum density of velocity history is analyzed. To obtain that value, power spectrum density is calculated for each point on the image frame and then averaged in the whole image. The results are shown in Fig. 8 for optical flow algorithm. The average power spectrum density contains the most important feature of the wake flow. A peak of power spectrum density is observed at Strouhal number around StD = 0.137. The frequency is connected to vortex shedding of the near- wake flow and it was reported widely in previous studies for blunt-base body. Fig. 8. Power spectral density by optical-flow algorithm 55 Journal of Science and Technique - N.211 (12-2020) - Le Quy Don Technical University 4.4. Proper Orthogonal Decomposition In this section, proper orthogonal decomposition (POD) is conducted to obtain the most dominated pattern of the flow. The technique was developed in details by Berkooz et al. [15]. Consequently, we do not present this technique in this paper. For more details, the reader can refer to previous studies of the technique. We use Matlab program to calculate the POD modes. In fact, the modes extracted by POD were not limited. However, the noise increases with mode number, so we used only the first ten modes in this study. Fig. 9 shows the relative energy of the first 10 modes, which occupies around 56% of the total energy. The flow pattern of the first sixth modes is illustrated in Fig. 10. Clearly, the first mode occupies around 17% of the total energy while the energy of the second mode is less than 12%. The results shows similar to previous study by Gentile et al. (2016) where energy of the first mode is 16%. Fig. 9. Relative energy of first 10 modes Interestingly, the first three modes show antisymmetric flow behavior, which is linked to different frequency of vortex shedding motion. The symmetric flow occurs at modes 4, 5 and 6. Clearly, at low Reynolds number, vortex shedding is the dominant characteristics of the near wake. 56 Journal of Science and Technique - N.211 (12-2020) - Le Quy Don Technical University a) Mode 1 with 17.3% of energy b) Mode 2 with 11.9% of energy c) Mode 3 with 6.2% of energy d) Mode 4 with 4.9% of energy e) Mode 5 with 3.5% of energy f) Mode 6 with 3.0% of energy Fig. 10. POD modes from optical flow results 57 Journal of Science and Technique - N.211 (12-2020) - Le Quy Don Technical University 5. Conclusion In this study, optical flow algorithm was applied to analyze unsteady behavior of near wake flow. The optical-flow method was validated by relevant results from previous studies. Results of optical flow showed high potential in analyzing the static and transient near-wake flow. The base flow is characterized by motion of vortex shedding at frequencies of StD = 0.137 and StD = 0.015. POD analysis indicates that the first 3 modes show antisymmetric behavior. The axisymmetric flow occurs at the fourth mode. The vortex shedding is dominant flow behavior at low-speed condition and low Reynolds number. Acknowledgments The authors would like to thank Professor Keisuke Asai and Professor Taku Nonomura at Department of Aerospace Engineering, Tohoku University in Japan for their support during the experimental process. References 1. Rigas G, Oxlade A. R., Morgans A. S., Morrison J. F. (2014). Low-dimensional dynamics of a turbulent axisymmetric wake. Journal of Fluids Mechanics, 755, R5. 2. Tanner, M. (1984). Steady base flows, Progress in Aerospace Sciences, 21, pp. 81-157. 3. Merz, R. A., Page, R. H. and Przirembel, C. E. G. (1978). Subsonic axisymmetric near- wake studies. AIAA Journal, 16(7), pp. 656-662. 4. Ilday, O., Acar, H., Elbay, M. K. and Atli, V. (1992). Wakes of three axisymmetric bodies at zero angle of attack. AIAA Journal, 31(6), pp. 1152-1154. 5. Mariotti, A. and Buresti, G. (2013). Experimental investigation on the influence of boundary layer thickness on the base pressure and near-wake flow features of an axisymmetric blunt-based body. Experiments in Fluids, 54:1612. 6. Markus, R., Christian, E. W., Fulvio, S. et al. (2013). Particle image velocimetry, Springer Nature, Switzerland. 7. Liu, T. and Shen, L. (2008). Fluid flow and optical flow. Journal of Fluid Mechanics, 614(11), pp. 253-291. 8. Tran, T. H., Ambo, T., Lee, T., Ozawa, K., Chen, L., Nonomura, T., Asai, K. (2019). Effect of Reynolds number on flow behavior and pressure drag of axisymmetric conical boattails in low-speed conditions. Experiments in Fluids, 60(3). 9. Liu, T., Merat, A., Makhmalbaf, H., Fajardo, C. and Merati, P. (2015). Comparison between optical flow and cross-correlation methods for extraction of velocity fields from particle images. Experiments in Fluids, 56:166. 58 Journal of Science and Technique - N.211 (12-2020) - Le Quy Don Technical University 10. Horn, B. K. and Schunck, B. G. (1981). Determining optical flow. Artificial Intelligence, 17 (1-3), pp. 185-204. 11. Wolf, C. C., Klei, C. E., Buffo, R. M., Hörnschemeyer, R. and Stumpf, E. (2012). Comparison of rocket near-wakes with and without nozzle simulation in subsonic freestream conditions. 42nd AIAA Fluid Dynamics Conference and Exhibit, AIAA Paper 2012-3019. 12. Gentile, V., Schrijer, F. F. J., Oudheusden, B. W. and Scarano F. (2015). Afterbody effects on axisymmetric base flows. AIAA Journal, pp. 2285-2294. 13. Atli, V. (1989). Wakes of four complex bodies of revolution at zero angle of attack. AIAA Journal, 27(6). 14. Bury, Y., Jardin, T. (2012). Transitions to chaos in the wake of an axisymmetric bluff body. Physics Letters A, 376, pp. 3219-3222. 15. Berkooz, G., Holmes, P. and Lumley, J. L. (2003). The proper orthogonal decomposition in the analysis of turbulent flows. Annual Review of Fluid Mechanics, 25, pp. 539-575. NGHIÊN CỨU ĐẶC TÍNH KHÔNG DỪNG DÒNG CHẢY SAU ĐUÔI CỦA VẬT ĐÁY TÙ BẰNG PHƯƠNG PHÁP XỬ LÝ ẢNH Tóm tắt: Trong nghiên cứu này, phương pháp luồng quang được sử dụng để nghiên cứu tính không dừng sau đuôi vật. Thực nghiệm được thực hiện ở điều kiện tốc độ thấp và ở số 4 Reynolds ReD = 1,97×10 nhằm xây dựng dữ liệu ảnh cho xử lý luồng quang. Tần số đo là 2000 khung hình/giây. Kết quả của phương pháp luồng quang được so sánh với các nghiên cứu trước đó sử dụng phương pháp tương quan chéo. Do đó, khả năng của phương pháp luồng quang để trích xuất các trường dòng chảy được xác nhận đối với dòng chảy sau đuôi của vật đáy tù ở điều kiện tốc độ thấp. Khác biệt với các kết quả trước đó sử dụng tương quan chéo, phương pháp luồng quang chỉ ra số Strouhal đặc trưng tại StD = 0,015, liên quan tới tính dao động xoáy của dòng chảy sau đuôi. Ngoài ra, tính bất đối xứng là đặc trưng quan trọng nhất của dòng chảy sau đuôi ở điều kiện vận tốc nhỏ. Từ khoá: Luồng quang; vật thể đối xứng trục; dòng chảy đuôi; vùng chảy ngược; PIV. Received: 04/6/2020; Revised: 24/11/2020; Accepted for publication: 26/11/2020 59
File đính kèm:
 investigation_on_unsteady_behavior_of_near_wake_flow_of_a_bl.pdf

